Disaster Management Manual
A manual for practitioners and decision makers!

Disaster Management Manual
A manual for practitioners and decision makers!
System stressors include events such as floods (flash flood, coastal flood and dry day flooding), wildfires, earthquakes, thunderstorms, hurricanes, tornadoes, typhoons, cyclones, drought, pandemic (transportation workforce), large scale transportation accidents/disasters affecting infrastructure by land (roadway, transit, railway), by sea (port, waterway/lock) and air (aviation).
California Department of Transportation (Caltrans) identified climate stressors ‘or hazards to infrastructure, public health and safety, natural systems, the economy, and other assets and systems that we rely on for a functional society. For Caltrans, the agency needed to consider which climate hazards would impact the State Highway System and its users. At the start of the vulnerability assessment, Caltrans met with internal and external subject matter experts to discuss which climate hazards could impact the highway system and why. Through these conversations, Caltrans focused the assessment on specific events and conditions that could present consequences to the state highway system.

Climate hazards assessed were:
Compound hazards encompassing urbanization, land use, cyber stresses and extreme climate events (i.e. rise in global temperature) also impact transportation.
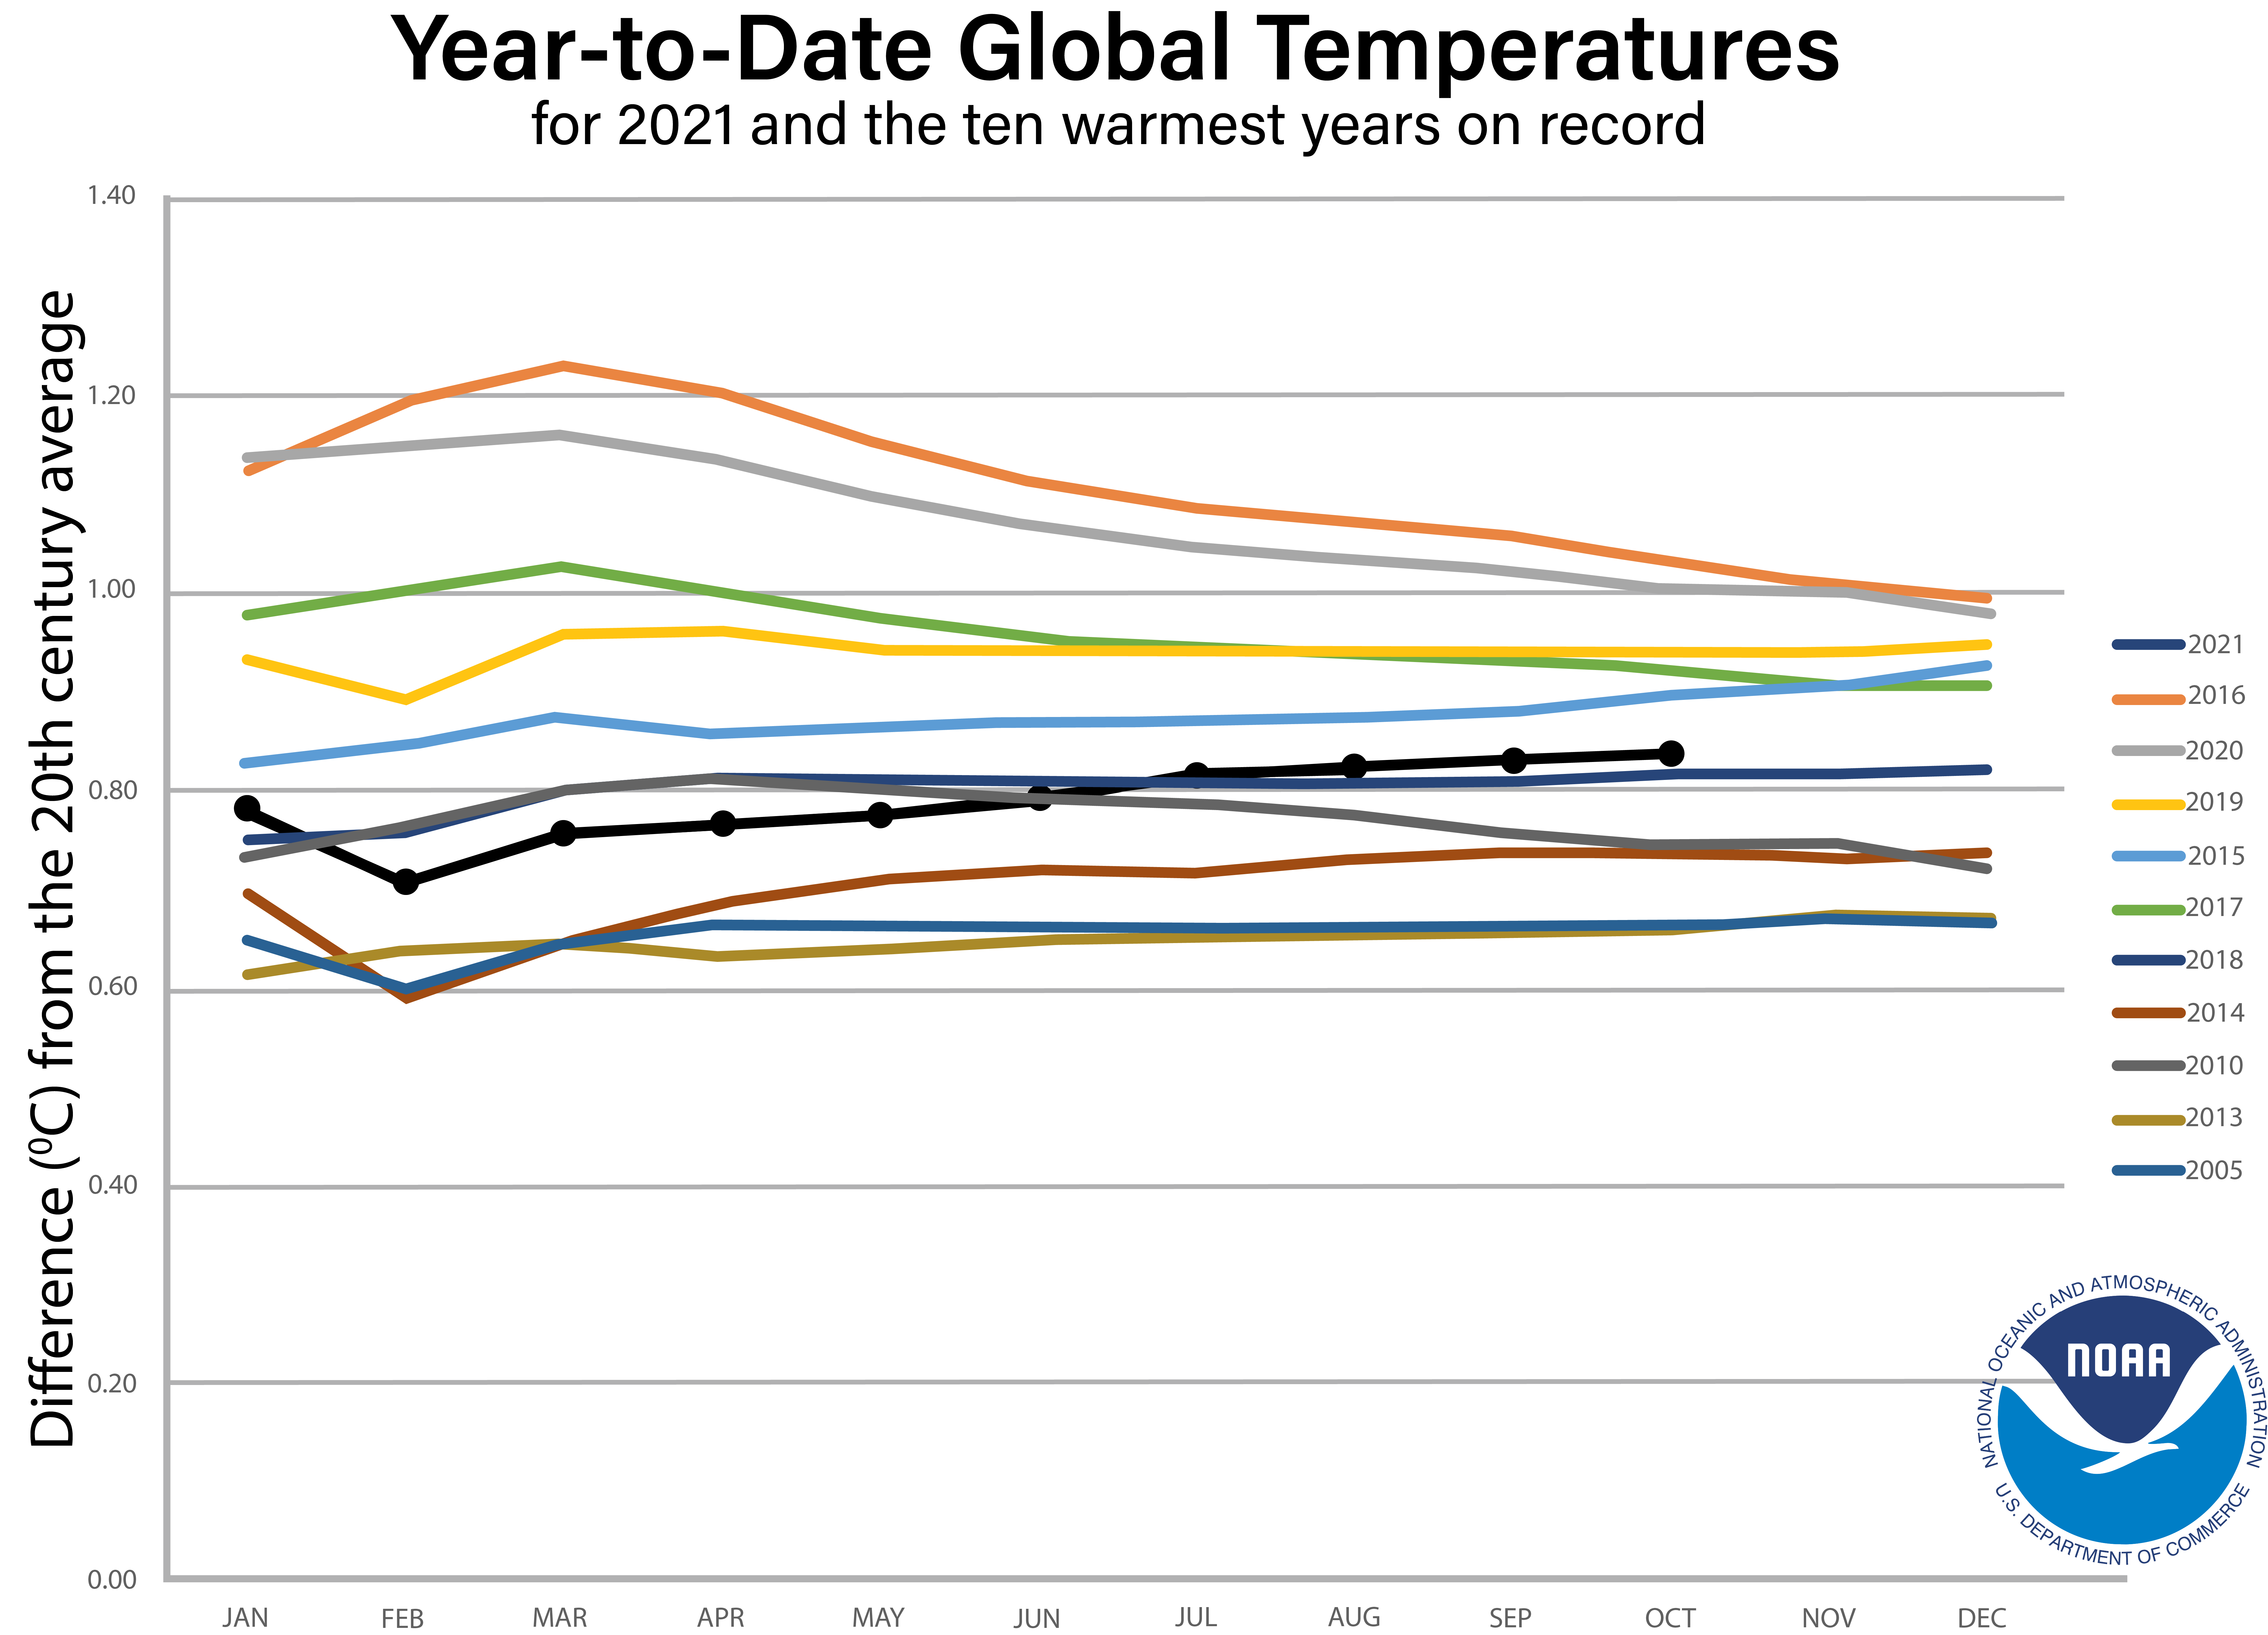
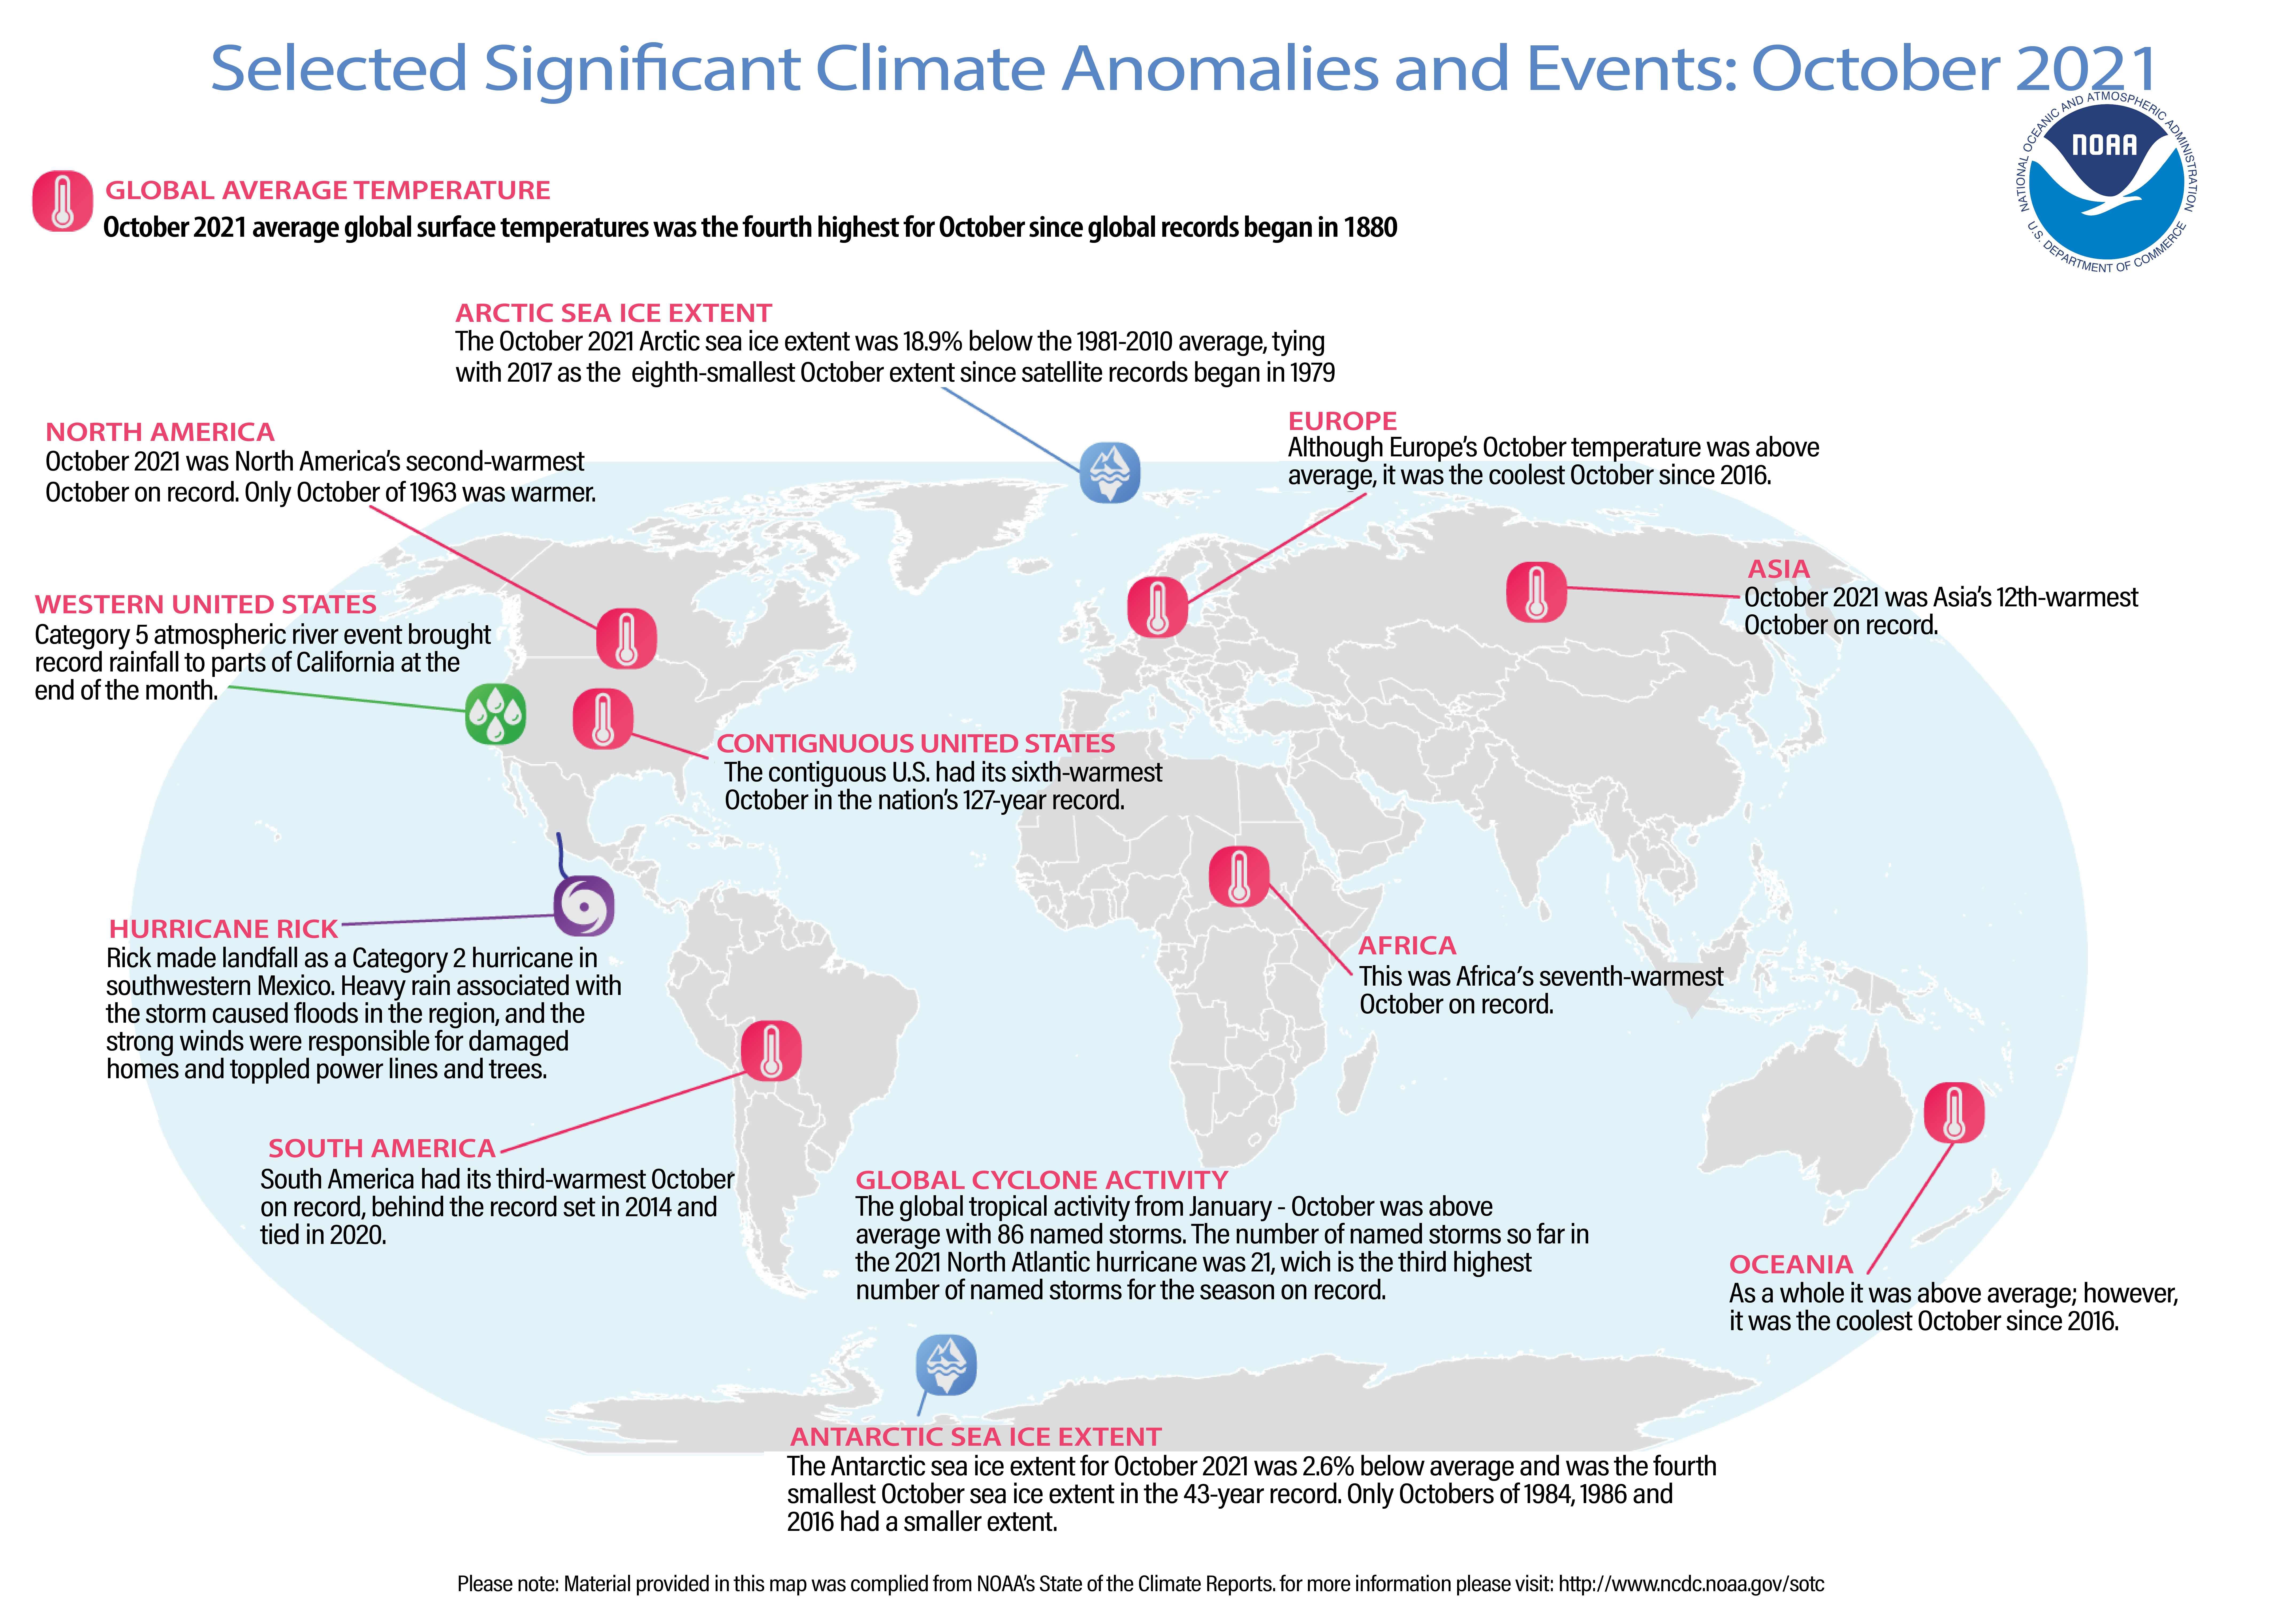
The following graph from the United States National Oceanic and Atmospheric Administration (NOAA) contains global temperatures during the ten warmest years on record: 2005, 2010, 2013, 2014, 2015, 2016, 2017, 2018, 2019 , 2020 and 2021. October 2021 ranked as the fourth-warmest October in 142 years, according to scientists at NOAA’s National Centers for Environmental Information. The map below contains significant climate anomalies & events occurring globally during October 2021.

Below is a map of the world plotted with some of the most significant climate events that occurred during October 2021. 2
