
Disaster Management Manual
A manual for practitioners and decision makers!
Disaster Management Manual
A manual for practitioners and decision makers!
Monitoring is defined by the Organisation for Economic Co-operation and Development (OECD) as "A continuing function that uses systematic collection of data on specified indicators to provide management and the main stakeholders of an ongoing development intervention with indications of the extent of progress and achievement of objectives and progress in the use of allocated funds” 1. The monitoring activity dealt with in this chapter is an activity to collect field data for evaluating the potential or hidden hazard risk.
When disasters are organized with a focus on the timeline of their occurrence mechanism, some events are recognized as having a relatively long time from the precursor or initial event to the occurrence of the disaster. In the case of earthquakes and typhoons, the time from the occurrence of the event to the occurrence of the disaster is generally short. For such events, preparedness activities are focused relatively on mitigating the disaster by providing early warning information. On the other hand, in the case of a slope disaster, where there is some time from the precursor or initial event to the onset of the disaster, although there are exceptions, preparedness activities are focused on mitigating the disaster by detecting the precursor or initial event, strengthening monitoring of the precursor or initial event, and determining countermeasures against the initial event based on the results of the monitoring. It is also important for road administrators to maintain road functions as much as possible for economic activities while giving top priority to ensuring the safety of road users. Thus, monitoring activities are one of the most important preparatory activities in disaster management to determine the necessity of prior road closure or appropriate slope improvement and its timing by confirming the development of the initial event and its trend. Figure 3.3.2.1 shows an example of a road slope disaster. 2
")
")
Figure 3.3.2.2 3 shows the management flow for slope disasters. Many inspections, monitoring, and countermeasure activities, as well as their overall management activities, are conducted to prevent or mitigate slope hazards. Since the mechanism of slope disasters is generally complex, it is important from the viewpoint of safety and efficiency to hand over from general maintenance activities to maintenance activities by specialists. Patrols and inspections are responsible for the detection of precursor events and initial events. However, patrollers and inspectors do not have specialized knowledge and training on slopes, and it is difficult for them to judge the influence of precursors and initial events on the progression to disaster occurrence. Therefore, it is necessary to shift to monitoring activities by experts to realize safe and efficient maintenance management.
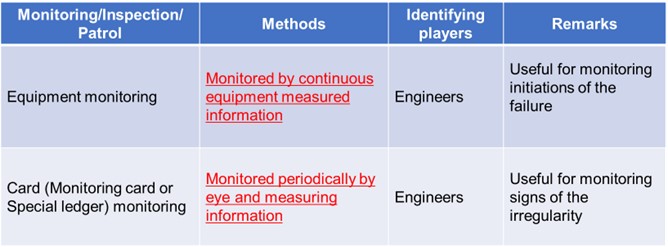
Monitoring can be classified into two categories: "chart inspection" (ledger inspection), in which data is collected periodically by visual inspection and measurement by expert inspectors and evaluated by expert engineers, and "monitoring" in a narrower sense, in which data is collected continuously using instruments to obtain more detailed data and evaluated by expert engineers. In Japan, especially in response to slope disasters, "chart inspection" is often conducted at the precursor stage, and if necessary, "monitoring" in the narrow sense is strengthened and "slope stability measures" are implemented. Thus, it is essential to utilize monitoring with different characteristics to ensure the safety of road users and to conduct efficient disaster management.
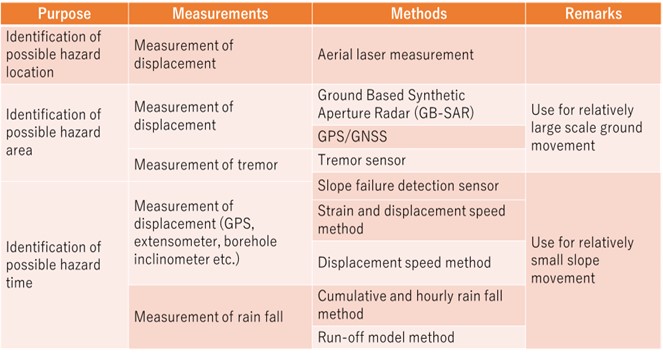
In the countermeasures against slope hazards, it is important to predict when, where, and on what scale, a slope disaster will occur. Table 3.3.2.1 4 shows a list of techniques for predicting when, where, and on what scale a slope disaster will occur.
For hazard prediction of "where" and "at what scale" road slopes will occur, satellite imagery, aerial surveying, and seismic observation have been used to identify large-scale possible hazard areas. However, due to the existence of a large number of road slopes in a wide area, the current situation relies on the detection of "anomalies" by road patrollers and regular inspectors. It is impossible to predict "when" a disaster will occur on a road slope with current technology. Therefore, structural measures (reinforcement, repair, etc.) are being taken to prevent the occurrence of disasters, and non-structural measures (road closures, etc.) are also being monitored to determine the necessity of such measures. For non-structural measures (road closures), "Early Warning Information" is issued based on rainfall monitoring information. This will be dealt with in the "Early Warning Information" section. As shown in Table 3.3.2.2, this chapter describes the "monitoring" that is conducted to obtain decision-making materials for structural measures.
In order to evaluate the stability of the slope and to determine the timing of the implementation of stability improvement measures, monitoring is divided into two types: continuous measurement monitoring using equipment, and chart inspection conducted by engineers using periodic visual inspection and simple measurements.
In continuous monitoring, the displacement rate (difference in displacement in hours or days) is calculated from the amount of displacement and strain obtained from extensometers, GPS, and in-hole inclinometers, and when the displacement rate exceeds the threshold value, stability improvement measures are carried out or the road is closed. Since the displacement rate that leads to slope failure varies depending on the size, slope, and material properties of the slope, the control threshold is set based on the characteristics of the individual slope based on laboratory tests and numerical analysis. However, due to the technical difficulty in predicting slope failure, the threshold values are often set based on the values proposed by researchers. For example, in the case of the threshold value for the extensometer, when the displacement rate reaches 2 mm to 4 mm/hour or more, the slope is judged to be close to collapse, and evacuation or road closure is often carried out. 4
In the case of GPS, when high measurement accuracy is required for engineering interpretation, such as slope failure and landslide, objective judgment can be made by statistically processing the time series data using the static method. Although it depends on the calculation environment and the installation method, it has become possible to detect sudden small displacements of about 2 to 3 mm by time-series statistical analysis.
In remote sensing, a method has been proposed to classify and process satellite data, to create ground thematic maps, and to create hazard prediction images through quantitative analysis based on these data.
The investigation of surface deformation is conducted to define the boundaries of the landslide, size, level of activity and directions of the movement, and to determine individual moving blocks of the main slide. The presence of scarps and transverse cracks are useful for determining whether the potential for future activity exists.
Examples of equipment used for the surface deformation investigation include extensometers, ground tiltmeters, movement determination by survey methods including transverse survey, grid survey, laser survey from the opposite bank, movement determination by aerial photographs, and GPS (Figure 3.3.2.3).

One of the simplest methods to determine landslide movement is to drive stakes across a tension crack along the direction of slide movement (Figure 3.3.2.4). Then attach a horizontal board to the stakes, and saw through the board. Any movement across the tension crack can be determined by measuring the displacement of the space created by cutting the board.
")
The extensometer is used to measure the amount of relative displacement between two points which are set on a moving and unmoving ground. The extensometers are generally installed across the main scarp, at transverse cracks and transverse ridges near the toe or front portion of the slide and parallel to the suspected slide direction (Figure 3.3.2.5). Measurements should be accurate to within 0.2 mm, and the magnitude of the movement and daily rainfall data should be recorded to establish the relationship between the measurable movement and the precipitation rate (Figure 3.3.2.6).


A control point is established across from a suspected sliding area on stable ground, and survey stakes are positioned within the slide. Laser survey is most effective where landslides are very active and the movement is large. Recently, a non-prism optical distance meter has been developed which does not require a specific target, and is used for monitoring on very steep slopes.
In recent years, GPS has been applied in landslide measurement to obtain three-dimensional positions of a landslide (Figure 3.3.2.7). It is also effective in identifying the moving direction and distances of a landslide.

The ground tiltmeter is useful for determining the deformation at the head and toe and sometimes along the flanks of the landslide, or to assess the possibility of future deformation. A "level type" tiltmeter is most conventional.
Recently, slope deformation detection systems using fiber optics have been tried. This system adopts the property of reduction in the optic medium within the fiber optics as it bends. It is possible to record the amount of deformation as well as the location of the deformation.
In order to identify the depth of slip surface for actively moving landslides, differences in velocities and moving patterns utilized along the slip surface are determined. Depending on the requirements for survey accuracy and magnitude of displacement, the appropriate instrumentation shall be selected from the following representative instruments: 1. Pipe strain gauge; and 2. Inclinometer.
PVC pipes with strain gauges are inserted into the boreholes, and the movement is detected by the change in the strain as the PVC pipe bends (Figure 3.3.2.8, and 3.3.2.9). The accuracy of detection increases as the intervals of the gauge narrows. Some lowest strain gauges must be anchored into the bedrock below the slip surface so that data from within the intact formation can be obtained.


A grooved casing is inserted into the borehole extending into the bedrock formation, and an adequate quality of grout should be placed into the borehole to assure an intimate contact with the borehole. By lowering a probe equipped with a tilt sensor, de· formation in the casing can be detected and movement of a landslide can be determined (Figure 3.3.2.10). An accurate measurement is possible where the deformation of a landslide is relatively small. As a landslide movement increases, the borehole and casing will bend making insertion of the probe difficult or the casing will exceed the tilt detection limit of the instrument.

In the past, measurements of slope deformation have been performed manually. More recently, automatic monitoring systems using data loggers and computers are being used. The instrument setup in the field has been designed for easy installation, and is weatherproof, durable, maintenance-friendly and economical.
Here are three main advantages in using the automated survey system:
Semi-automatic systems manually collect data from the data logger and sensor installed at the site on a periodic basis. Data can be retrieved directly from the hard drive of the computer or through flash memory.
Full-automatic monitoring systems permit remote control in real time and rapid graphic data processing and display. It is possible to store long term data accurately and effectively and would provide early warning signs of slide activity, thereby reducing landslide hazards (Figure 3.3.2.11).
Furthermore, recent developments in the intelligent construction systems at construction sites facilitate real time safety control during construction. In recent years, landslide monitoring systems utilizing information technology along with the existing full-automatic monitoring system and GIS have been developed (Figure 3.3.2.12, and 3.3.2.13).


