Disaster Management Manual
A manual for practitioners and decision makers!

Disaster Management Manual
A manual for practitioners and decision makers!
A hazard map is a map that shows the expected disaster areas and the locations of evacuation sites, evacuation routes and other disaster prevention facilities for the purpose of mitigating damage caused by natural disasters and for disaster prevention measures. It is sometimes called a disaster prevention map, damage forecast map, estimated damage map, disaster avoidance map, or risk map. Hazard maps are created based on disaster prevention geographic information, such as the history of past disasters, evacuation sites, and evacuation routes, as well as topographical and geological features that contribute to the formation of the land and predisposition to disasters in the area. 1
By using hazard maps, residents can evacuate quickly and accurately in the event of a disaster and avoid areas where secondary disasters are expected to occur, which is very effective in reducing damage from disasters.
The general flow of Hazard Map development.
The process of developing a road hazard map can be divided into the steps indicated in Table 3.3.1.1 2 In general, maps of lower levels are created, and then analysis and evaluation are conducted. Level 1 and Level 2 belong to the "unstable area map". The quality of the hazard map is proportional to the quality of the identification of unstable locations.
| Step | Name | Remarks |
|---|---|---|
| 1 | Inventory map | A map showing the cause of the instability (topographical map, aerial photographic interpretation map, geological map, disaster history map, etc.) |
| 2 | Susceptibility map | A map showing the source of the instability (including a map showing the instability) |
| 3 | Hazard map | A map showing the area from the source to the impact area |
| 4 | Fragility map | A map showing the probability of occurrence of the above hazard (probability of source to impact area) in relation to the triggers. |
| 5 | Real time hazard map | A map of hazards that is updated and displayed sequentially, based on real-time data on rainfall and other triggers, and hazard assessment. |
| 6 | Risk map | A map showing the human and social economic risks of hazards. |
For the purpose of mitigating damage caused by floods by ensuring smooth and prompt evacuation or preventing flooding, flood hazard maps are published showing the estimated depth and duration of flooding for areas that are expected to be inundated if the river overflows due to the maximum possible rainfall. The areas that are expected to be inundated if the river overflows due to rainfall, which is the basis of the river flood prevention plan, and the expected depth of water in case of inundation are also published. These are generally referred to as flood hazard maps. 3 Figure 3.3.1.1 shows an example of the flood hazard map. 4
A volcanic hazard map is a map of the area that may be affected by volcanic hazards (large cinder cones, pyroclastic flows, snow-melting volcanic mudflows, etc.). The maps are used as basic data to study evacuation plans during normal times, and to study disaster prevention measures such as mountain entry restrictions, evacuation, and land use during eruptions. 5 Figure 3.3.1.2 shows an example of the volcanic hazard map.6
A seismic hazard map is a map that shows predicted information such as the level of tremors that may be caused by future earthquakes, the likelihood of strong tremors in each region within a certain period of time, and the extent of damage caused by earthquakes.
The probabilistic seismic motion prediction map is a map that shows the results of the evaluation of the possibility of strong shaking in each region in the future, taking into account the possibility of long-term occurrence of such earthquakes.
The "Earthquake Motion Prediction Map Specifying the Source Fault" shows how strong the shaking will be in the area to be evaluated when the earthquake occurs by assuming scenarios such as how the source fault will shift and move in response to a specific earthquake.
In addition, there are hazard maps that predict building damage by region and handle the risk of liquefaction of the ground.
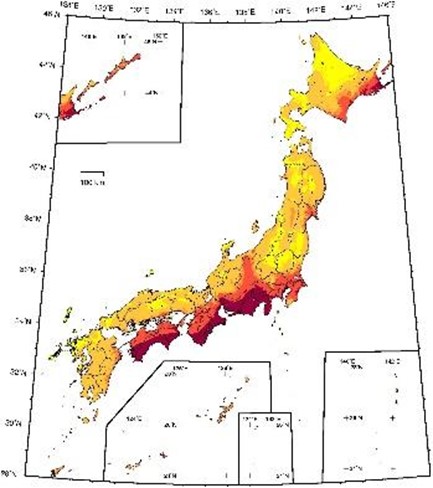
Figure 3.3.1.3 shows an example of the seismic hazard map. 8

Exceedance probability within 30 years considering all earthquakes (JMA seismic intensity: 6 Lower or more; average case; period starting Jan. 2010)
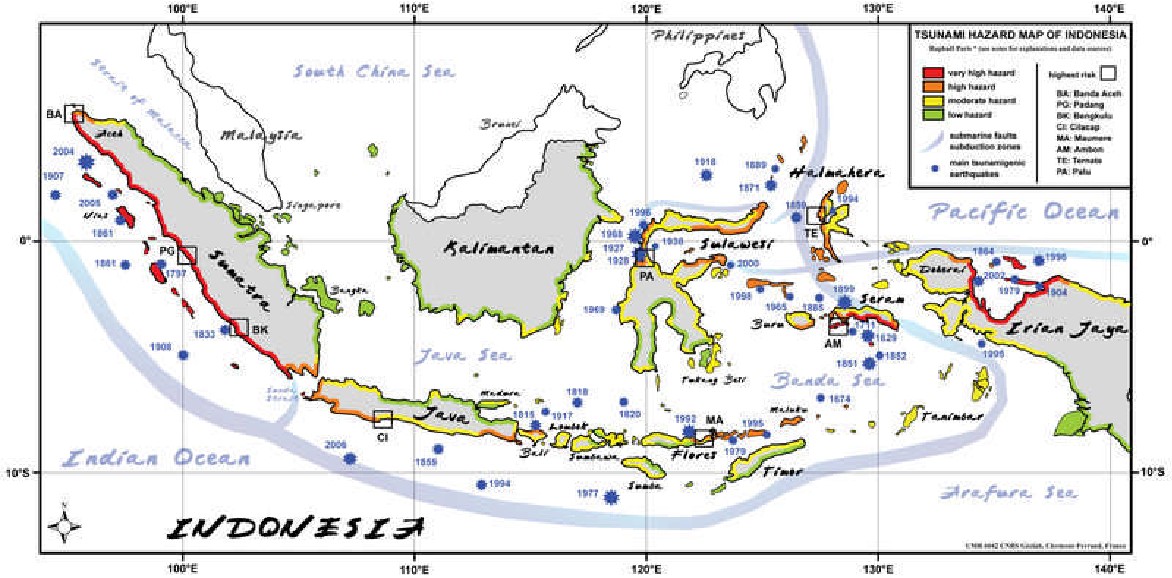
A tsunami and storm surge hazard map is a map that shows the anticipated damage area and the extent of the damage, as well as related disaster management information such as evacuation sites and routes, if necessary, for the purpose of considering evacuation of local residents and construction of facilities against tsunami and storm surge disasters. 9 Figure 3.3.1.4 shows an example of the tsunami hazard map. 10

Geo-hazard is a phenomenon triggered by heavy rains or earthquakes that causes 1) mountains and cliffs to collapse, and 2) soil and rocks mixed with water to flow out of rivers.
A geo-hazard map is a tool to provide residents with information on the risk of sediment disasters and evacuation in the event of a disaster and is developed mainly for the purpose of helping residents evacuate in the event of a disaster.
Geo-hazard can be broadly classified into three types: Rock falls (collapse of steep slopes), Debris flows, and Slides as shown in Figure 3.3.1.5.
(a) Rock falls (collapses of steep slopes): Phenomena in which the resistance of soil materials is weakened by rain or earthquake and the slope collapses rapidly. When a Slope failure strikes a house, many people fail to escape, and the rate of death is high.
(b) Debris flows: Phenomena in which a portion of the soil, sand, and stones that make up a hillside or streambed is combined with water due to rain, etc., and swept downstream at high speed. The flow speed is 20 to 40 km/h and can destroy houses in a moment.
(c) Slide: Phenomena in which rock or soil mass on a slope slowly moves downward along the sliding surface due to the influence of groundwater or earthquake. It is a general phenomenon that covers a wide area and has a high potential to cause serious damage due to a large amount of moving mass.

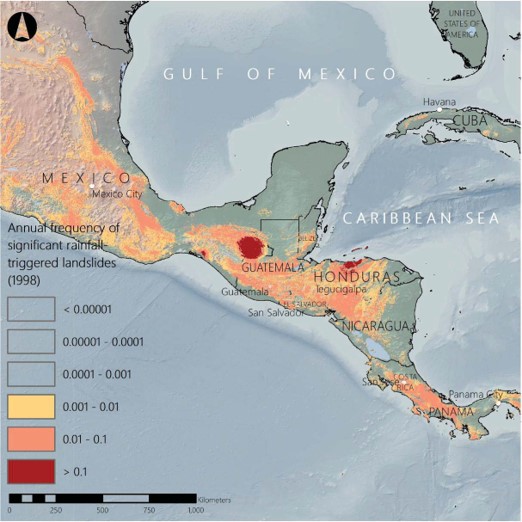
Figure 3.3.1.6 shows an example of the landslide hazard map. 12
