
One key factor of emergency management is the formation of plans through which communities reduce exposure to hazards and manage disasters. emergency management does not prevent or eliminate threats or hazards. It focuses on creating plans, best management practices, and standardized operating procedures to decrease the impact of disasters.

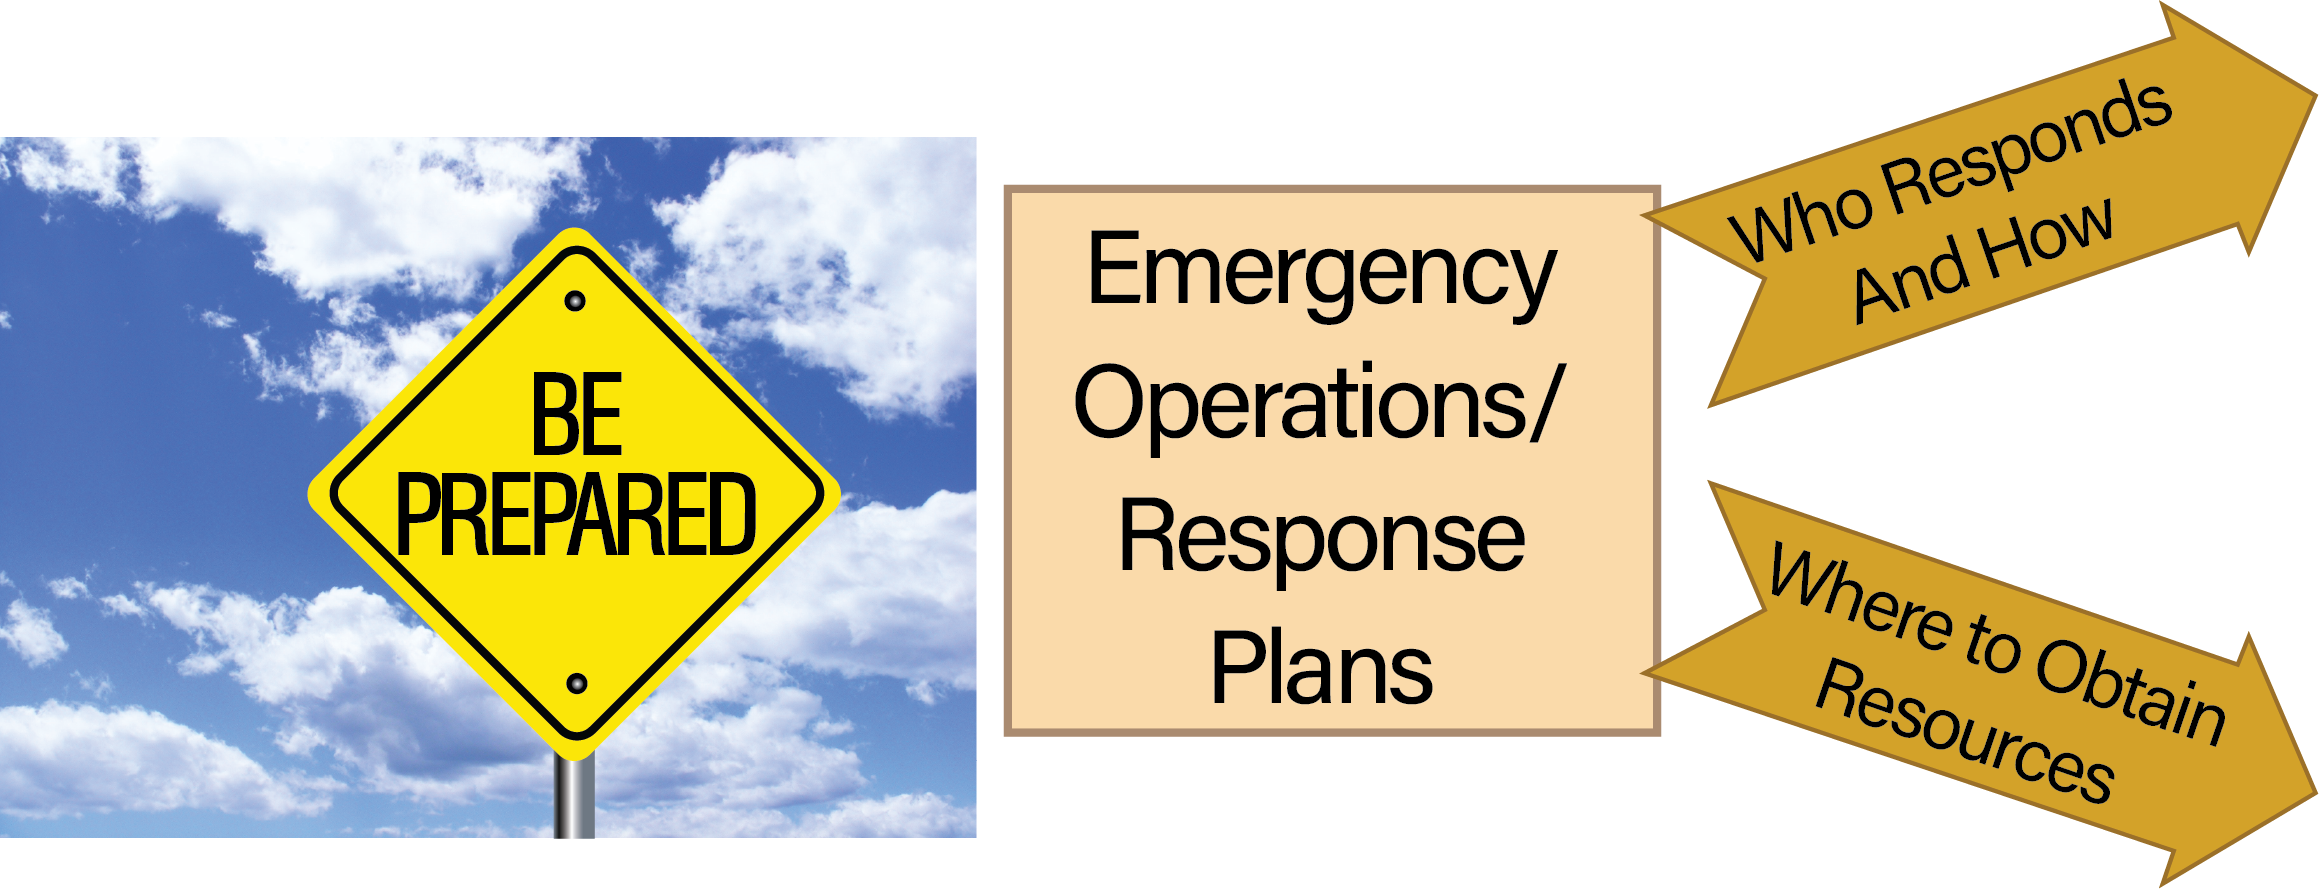
Figure 1.3.2 FHWA Graphic
Once threats and hazards have been identified, plans can be written. Plans generally address the areas of:
Operations or response plans address:
An objective of an Emergency Operations Plans (EOP) is to mitigate, prepare for, respond to, and recover from emergencies impacting transport Infrastructure. One example of an EOP is from Caltifornia’s Department of Transportation (Caltrans). Caltrans EOP is consistent with various United States federal emergency planning concepts, such as the Federal Emergency Management Agency (FEMA) National Response Framework (NRF), Federal and State Catastrophic Concept of Operations (CONOPS), and (Continuation of Operations/Continuation of Government (COOP/COG) Plans. The Caltrans EOP is centered on the California Standardized Emergency Management System (SEMS) and the Incident Command System (ICS) and is part of a larger framework that supports emergency management within the state of California. This larger framework is directed by the State of California Emergency Plan, hereinafter referred to as the SEP. The Caltrans EOP has the following purposes:
Another aspect of emergency management that is sometimes overlooked but should be addressed, is human behavior. Human behavior in carrying out the emergency management mission should be addressed. How people actually react and why certain behaviors occur during emergencies should be mitigated in plans. We should accept what does happen and not what we want to believe happens. What we plan, and what people actually do is increasingly different. We should design systems to support what people actually do. 2
Exposure defines the elements and locations of the highway system (roads, bridges, culverts, etc.) that may be exposed to changing conditions caused by climate change, including sea level rise, storm surge, wildfire, landslides, etc. Key indicators for this measure include the value and timing of expected changes (at what year could you expect these conditions to occur). 1
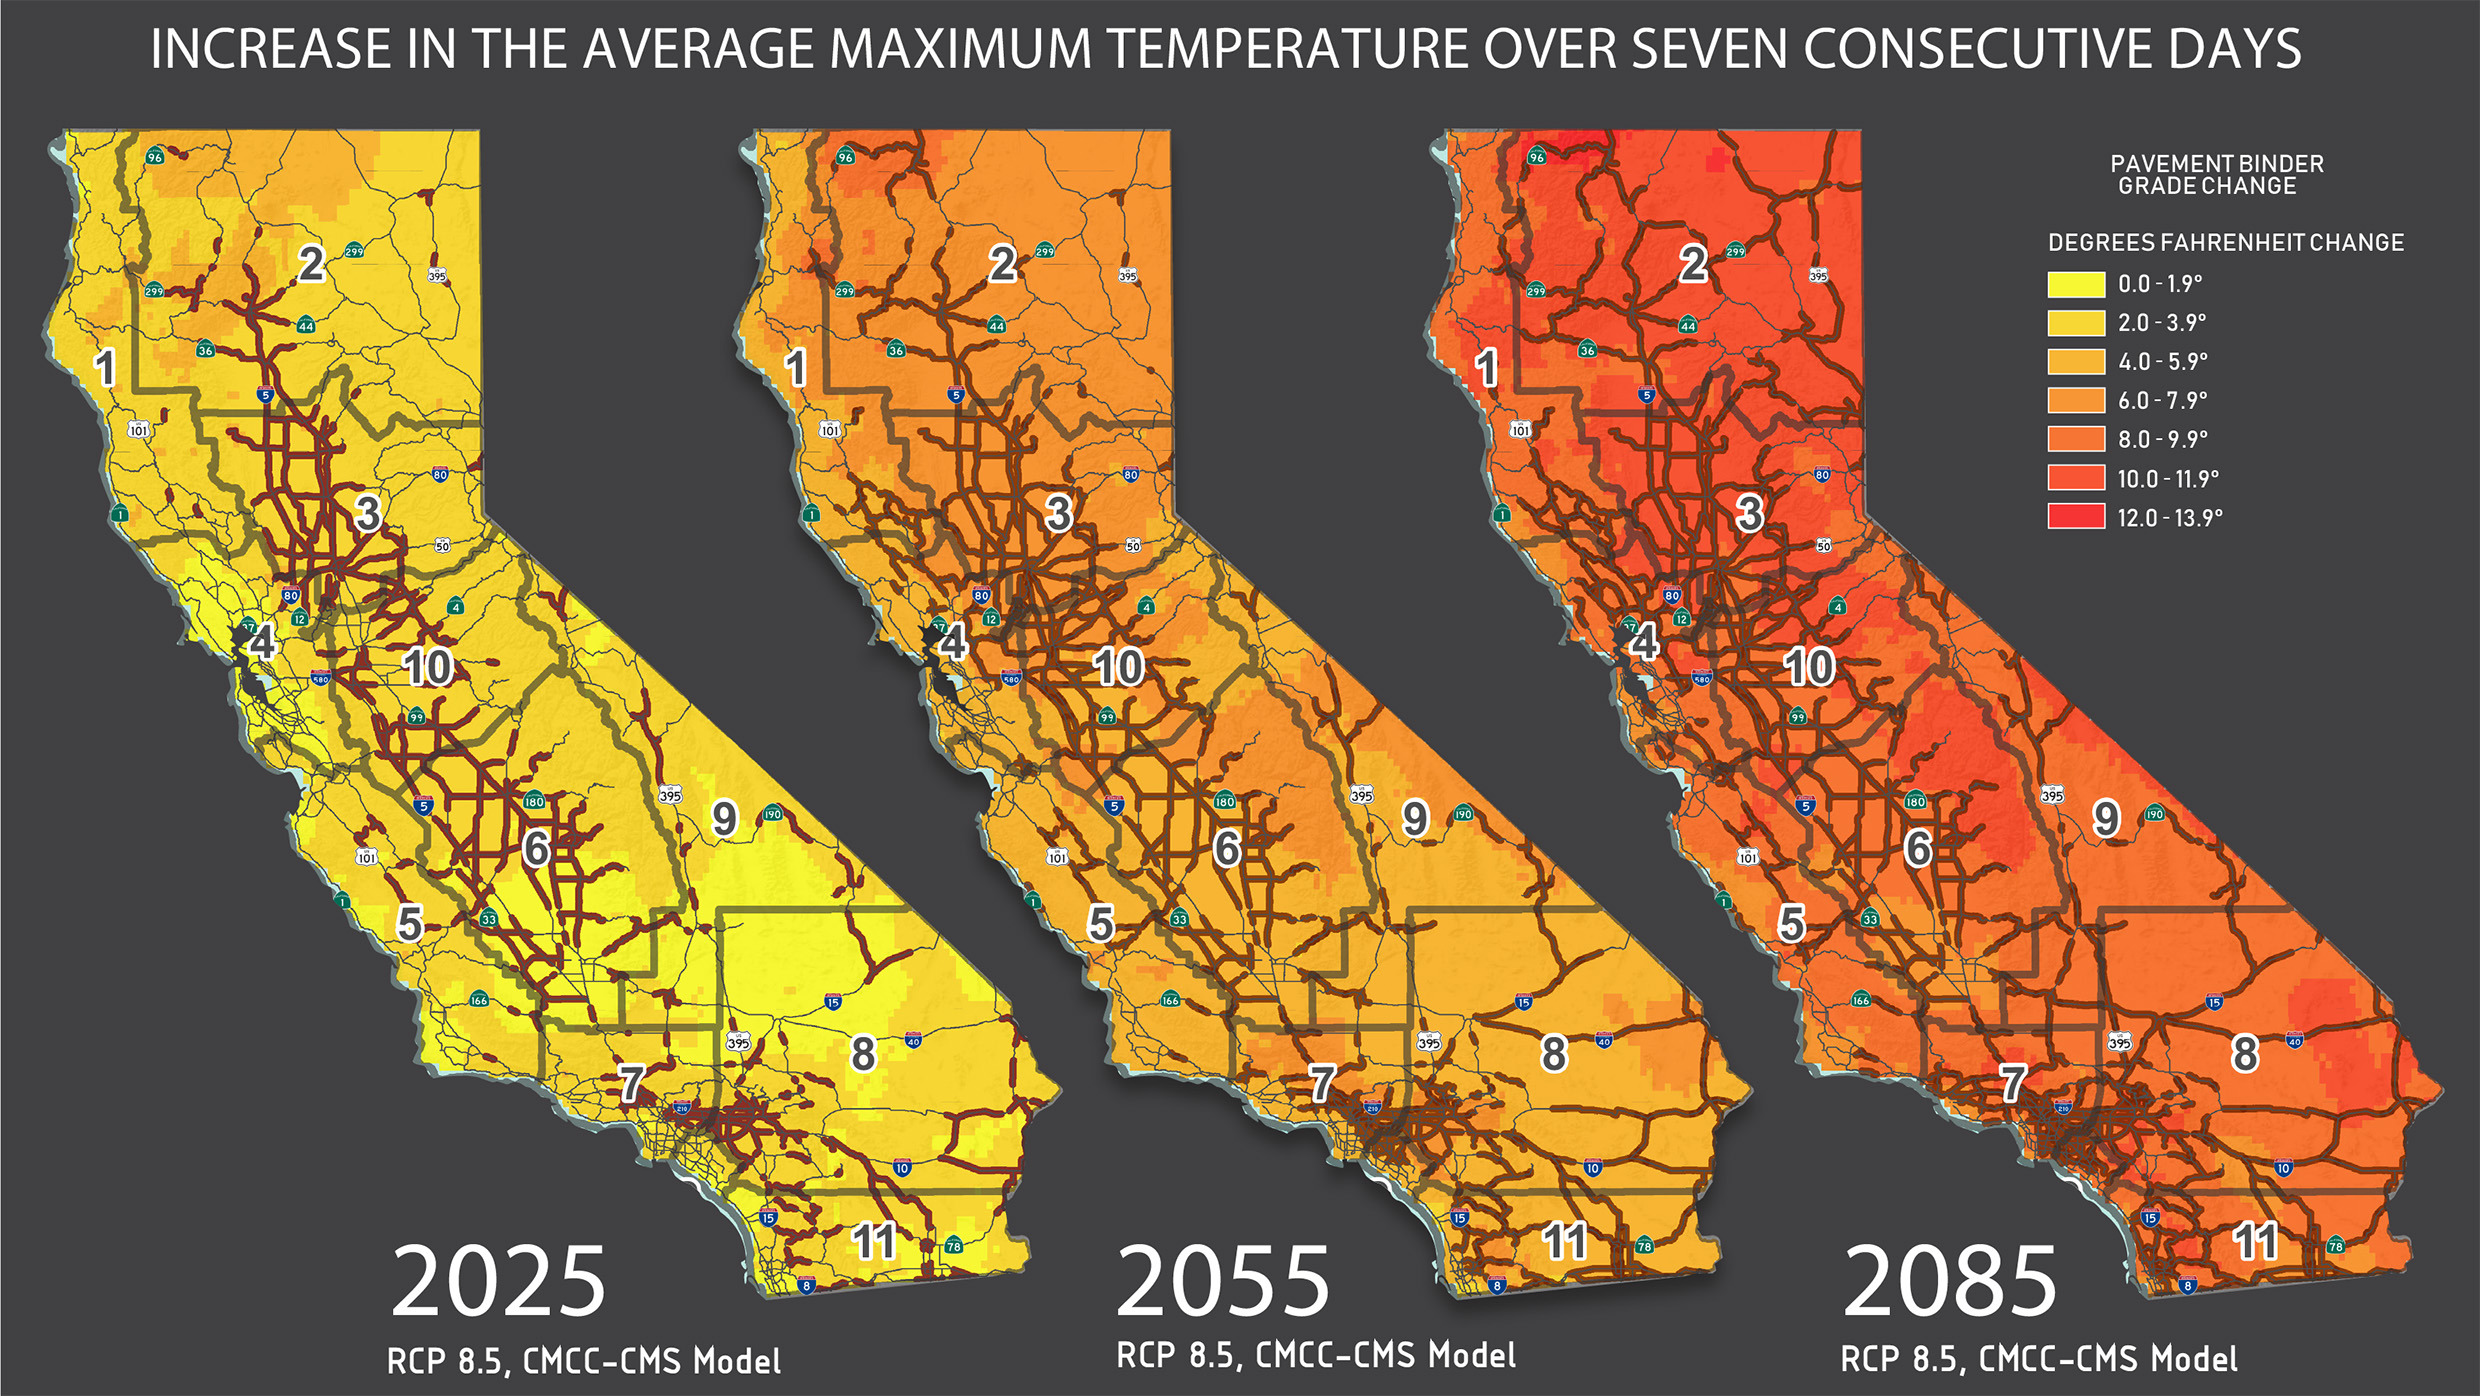
‘According to the United States National Climate Assessment, the number of extremely hot days is projected to continue to increase over much of the United States, especially by late in the century. Summer temperatures are projected to continue rising, and a reduction of soil moisture, which exacerbates heat waves, is projected for much of the western and central US in summer. California’s size and its many highly varied climate zones cause inconsistent temperature rise across the state. The following Figure shows the average maximum temperature change over seven consecutive days within three different time periods compared to data from 1975 to 2004. Caltrans evaluated the minimum and maximum temperature changes because they are important considerations for selecting pavement binder–the “glue” that binds asphalt aggregates. The Figure highlights portions of the State Highway System where the historical pavement binder temperature range is exceeded. Notice that as time goes on, more of the network becomes exposed to high temperatures that could affect pavement conditions.’ 2

Figure 1.3.2.1 Caltrans Graphic
Caltrans vulnerability studies contain similar mapping for statewide precipitation, wildfire, sea level rise, storm surge and cliff retreat.
The California Department of Transportation (Caltrans) Identified the implications of extreme weather or climate change on Caltrans assets. Key variables include estimates of cost of damage, and the duration of closure to repair or replace the asset. The consequence of failure from climate change would include such concerns as (among others):

Figure 1.3.2.2.1 Flow Path for Vulnerability Assessment
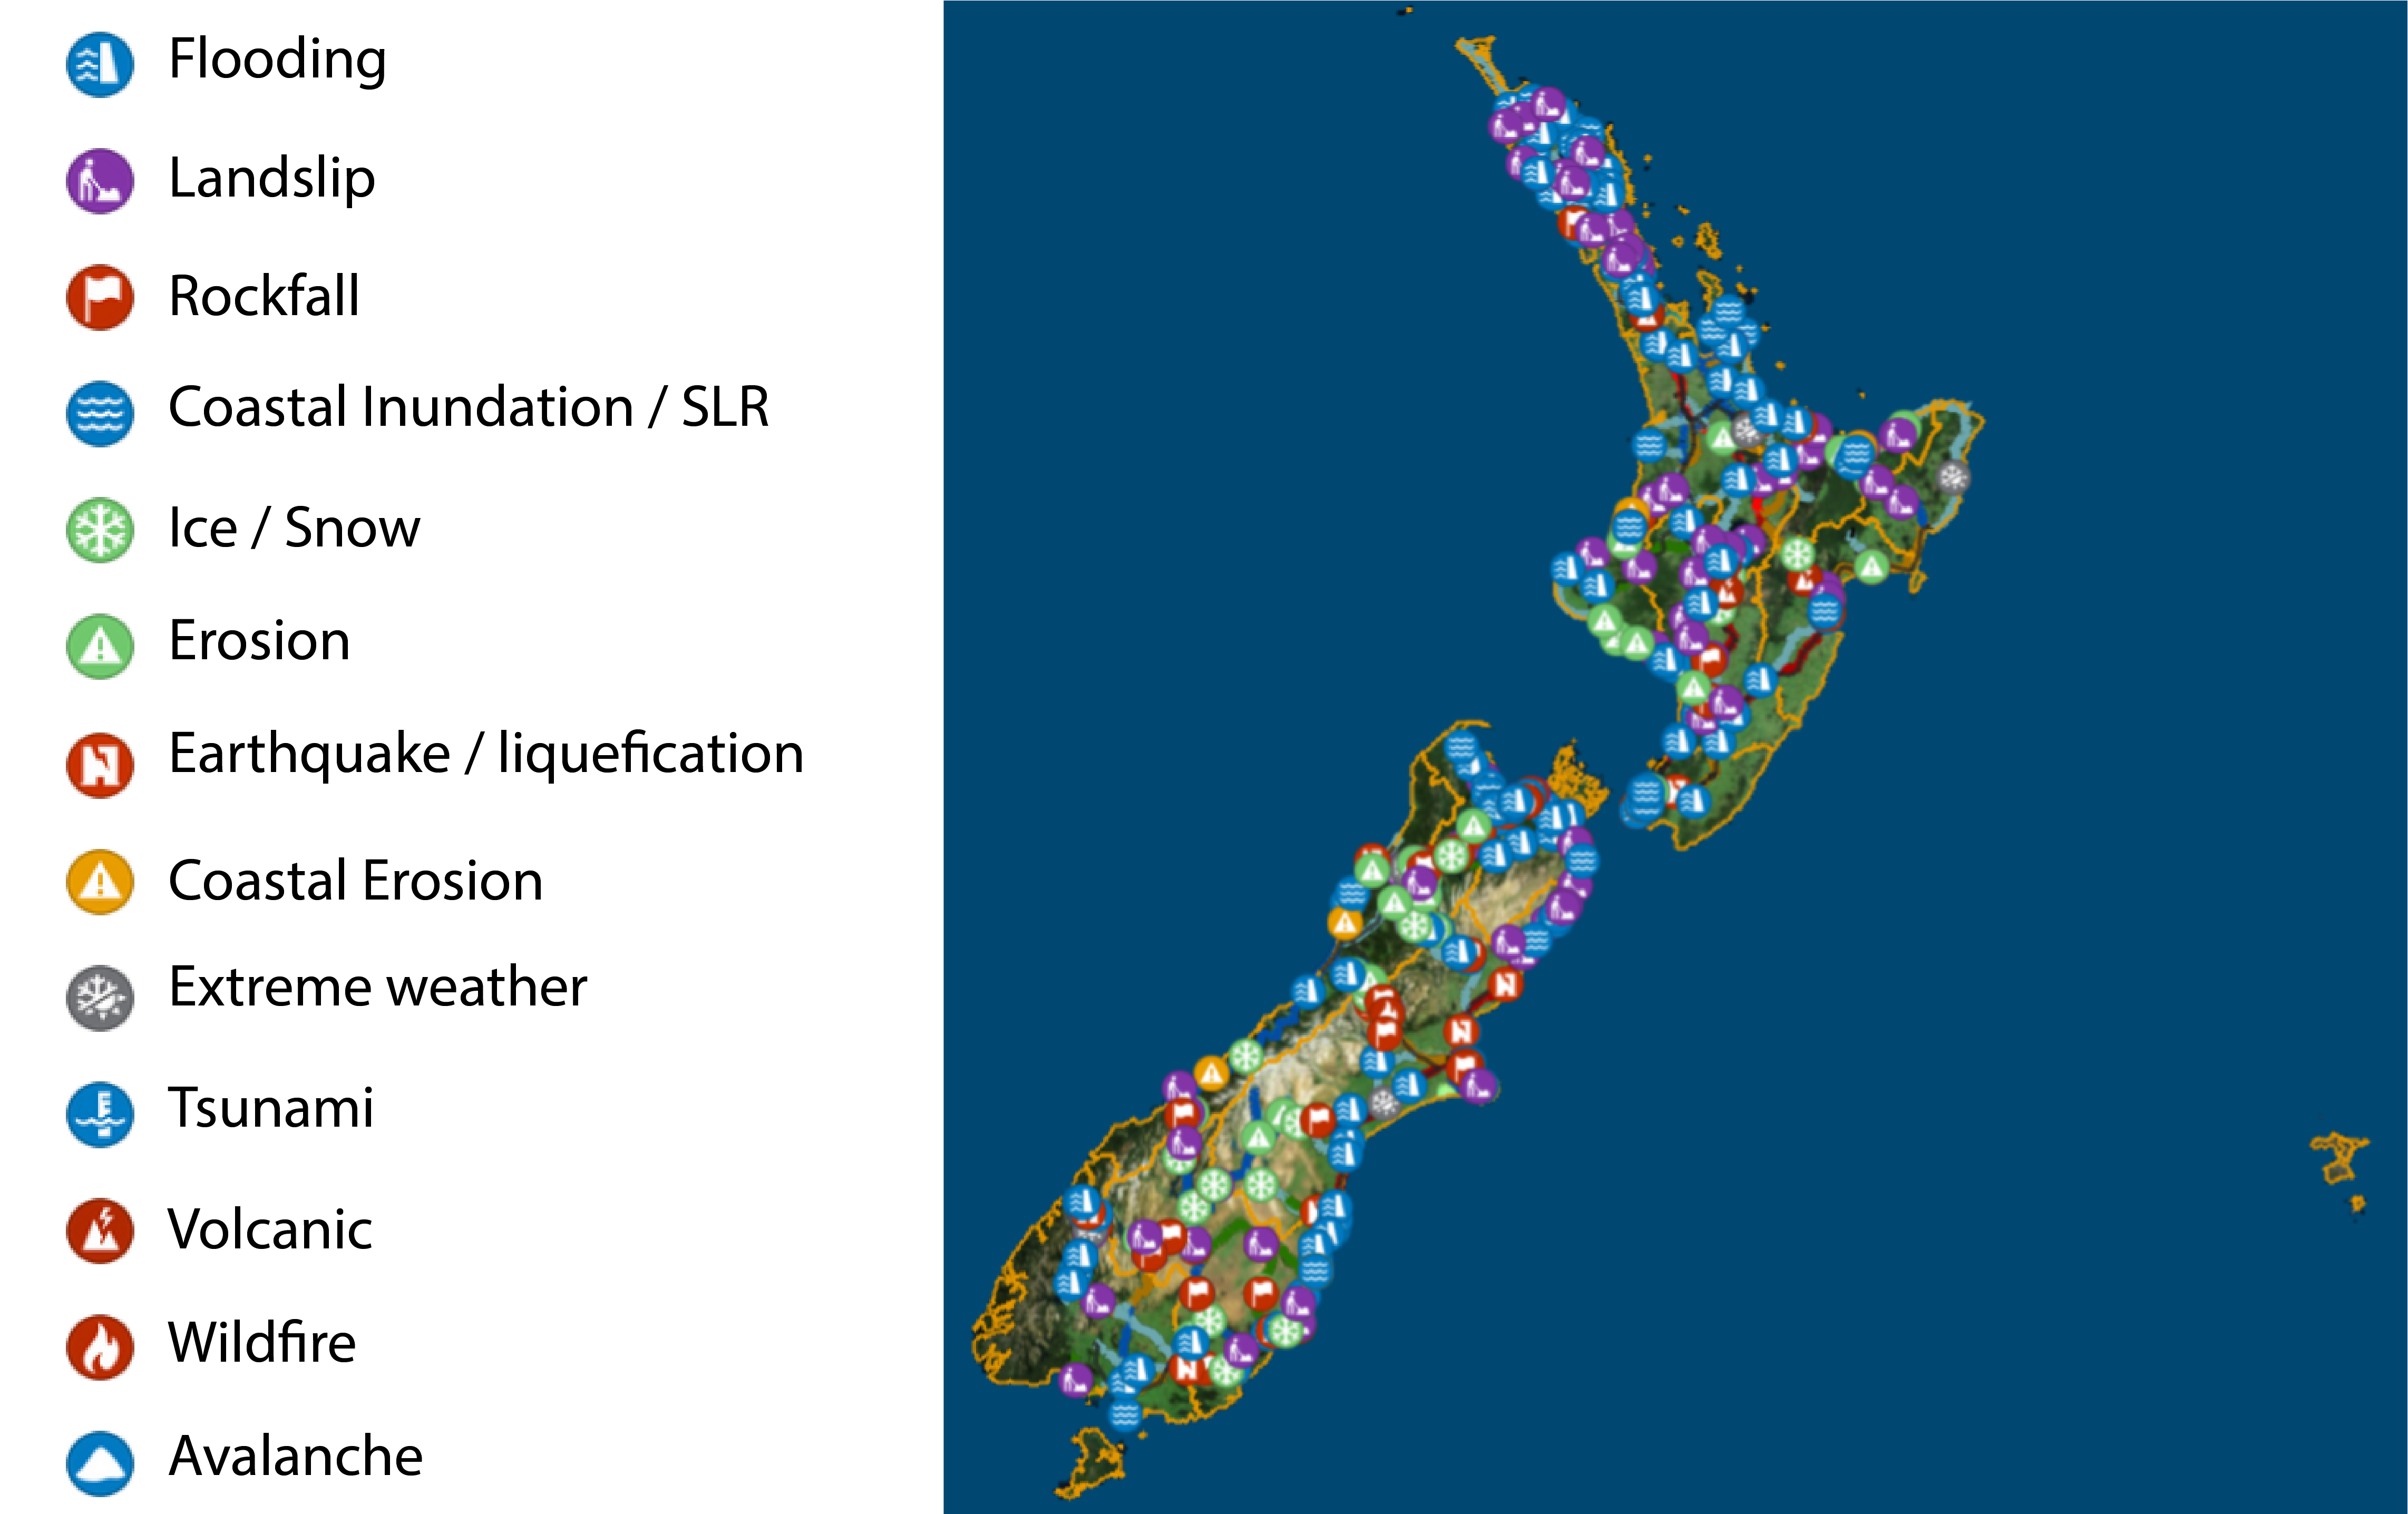
The New Zealand Transport Agency's list of hazards producing consequences: 2

Figure 1.3.2.2.2 National Resilience Programme Business Case 2020
The California Department of Transportation (Caltrans) created district Adaptation Priorities Reports that use an indicator-based scoring approach to rank state highway system assets most vulnerable to the impacts of climate change. These reports will identify prioritized assets for detailed facility-level study of climate change and adaptation options. Other factors will also affect final prioritization and adaptations, including route criticality, population served, equity considerations, asset useful life, projects underway, funding availability, and cost considerations’ 1
The development of a method to support investment decisions among multiple options prioritizes disaster management that reflects future climate risk, including such considerations as:
By using this approach, the California Department of Transportation (Caltrans) can capitalize on its internal capabilities to identify projects that increase highway system resiliency.
‘Asset condition is one of the most oft-used surrogates for a resilience metric. The focus of such metrics is on the physical ability of an asset to minimize or forego material disruption or failure. Bridge and asset security resilience metrics are good examples of this (similar indices are found for pavement condition and other asset categories found in a typical transportation agency).’ 2

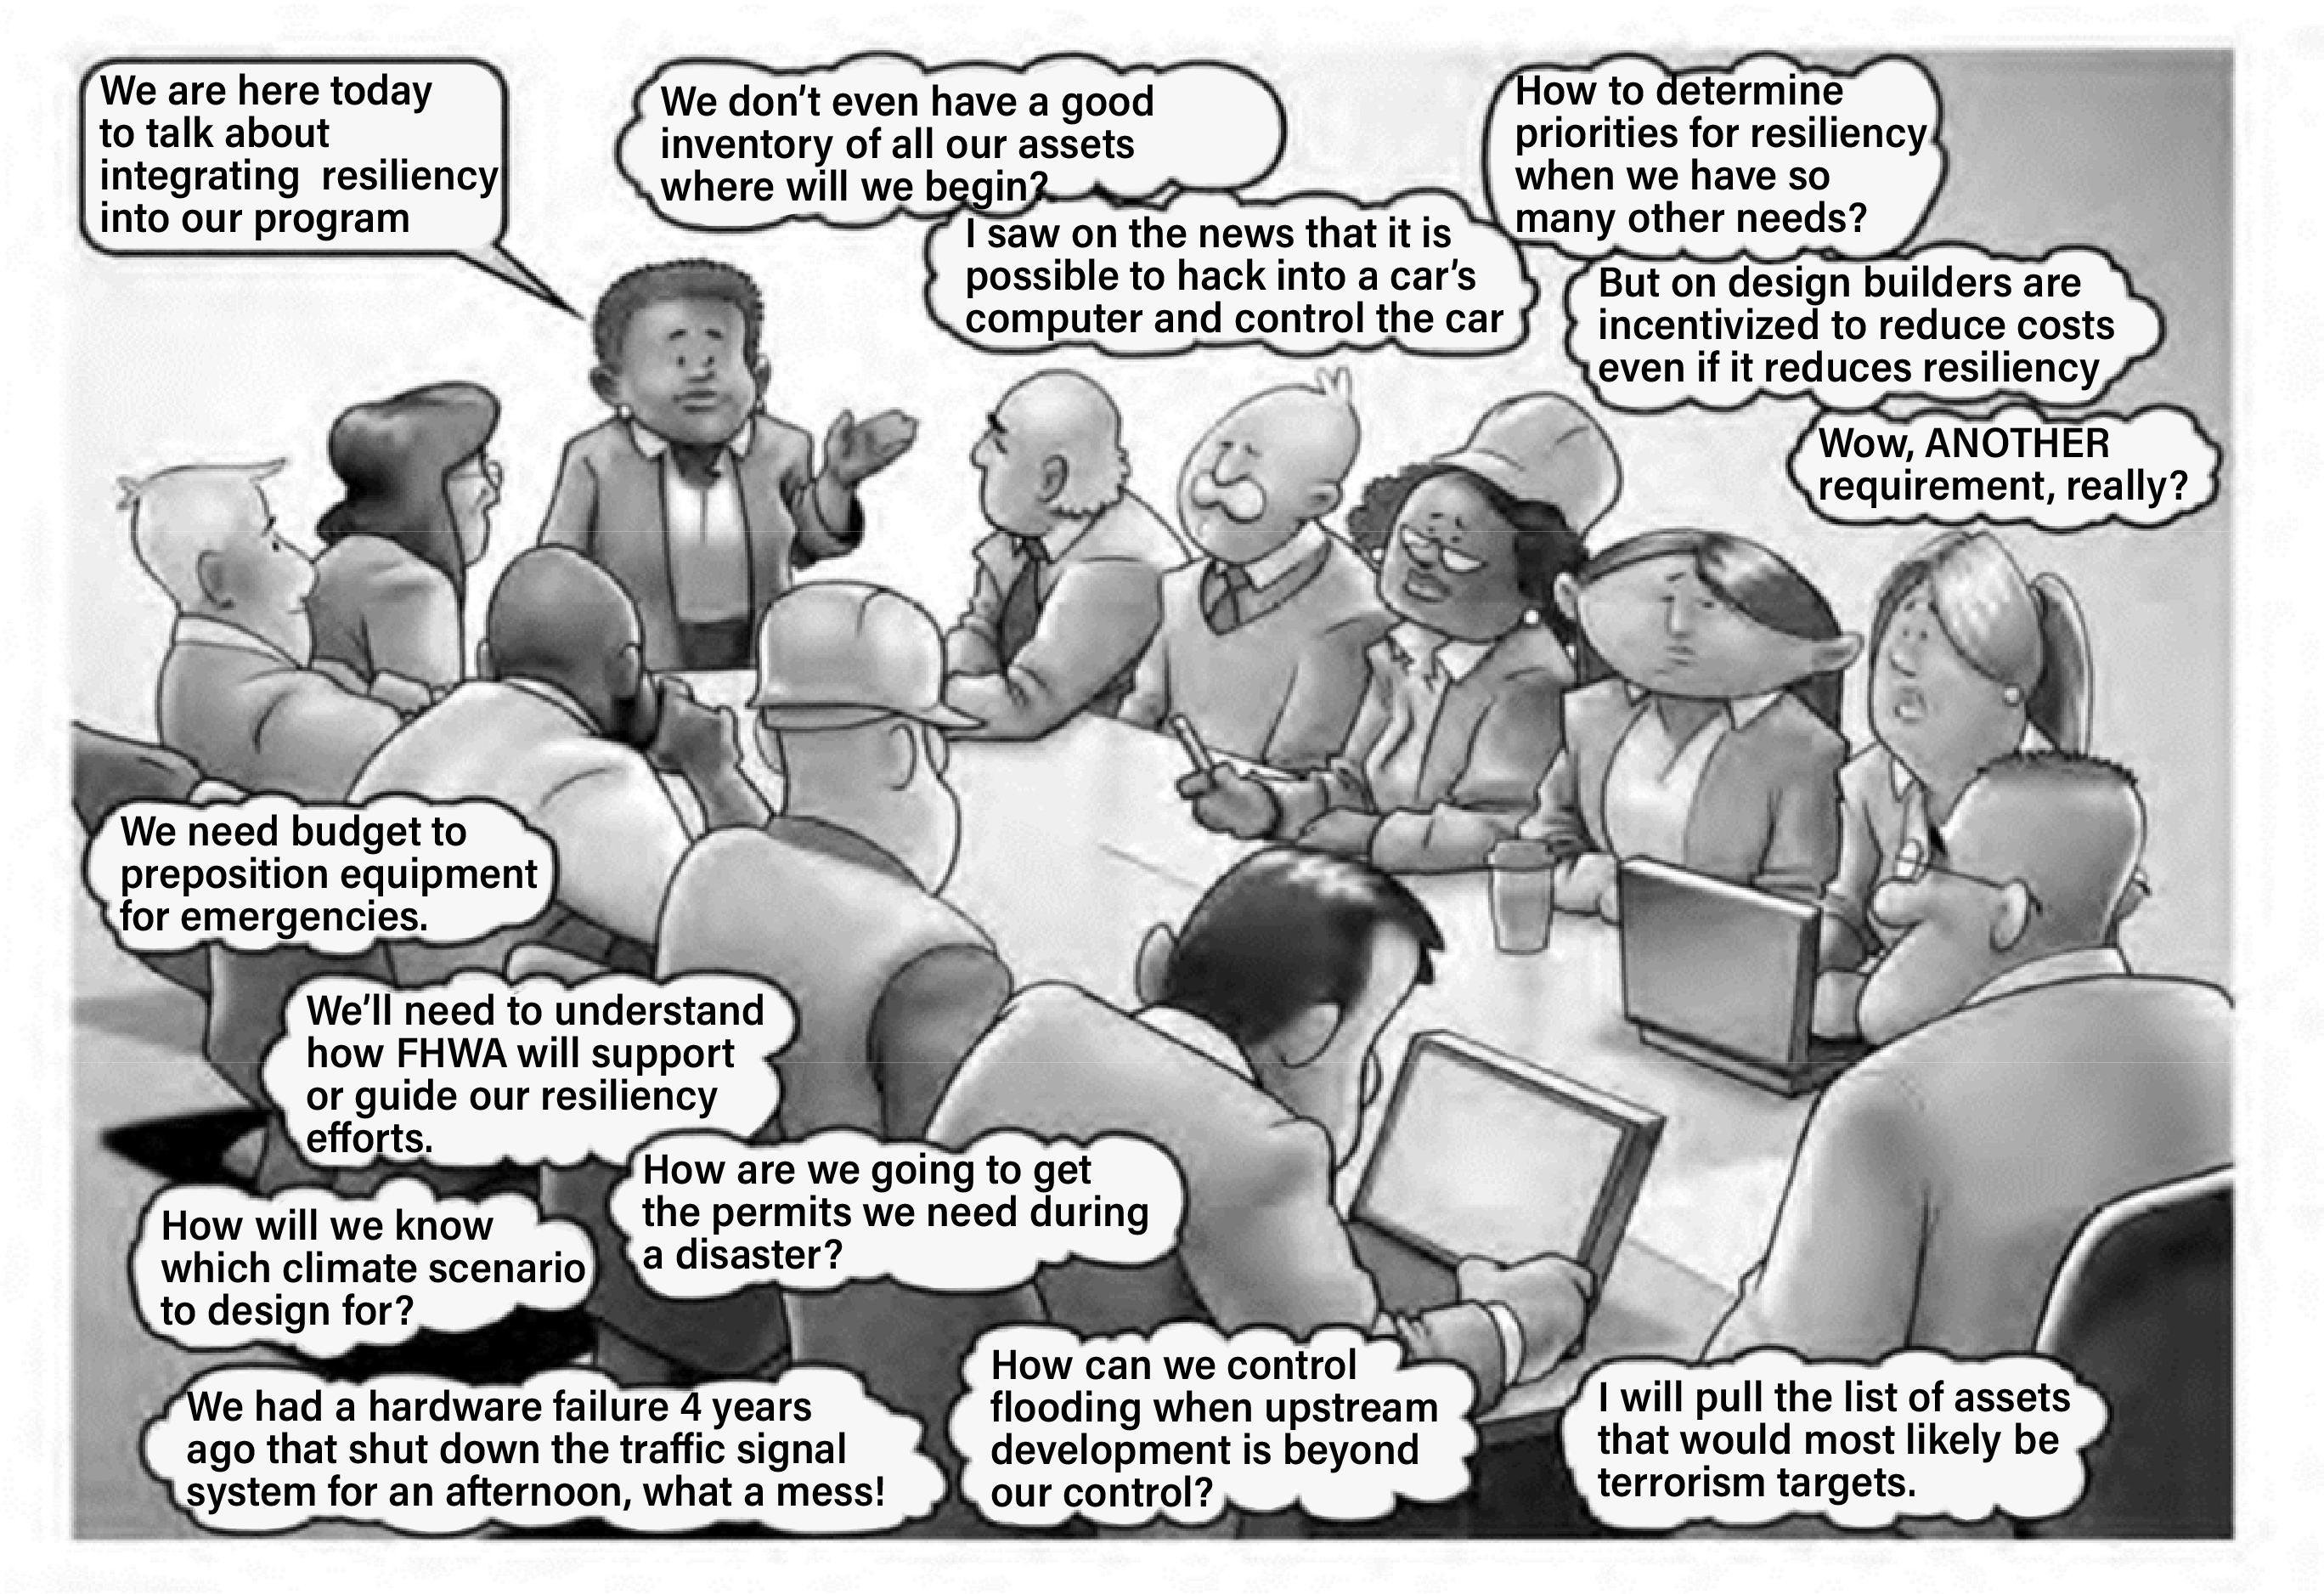
Figure 1.3.2.3 Perspectives Vary from Deploying State Resilience
Assessing disaster risk for the supply chain (economic resilience) is important and a great way to start assessing resilience of the system through all modes of transportation.
Asia-Pacific Economic Cooperation’s (APEC) 21 member economies are disproportionately impacted by natural disasters. Economic costs are caused by the destruction of economic and social infrastructure as well as disruptions to supply chains and the resulting loss of trade revenue.’

Figure 1.3.2.4 APEC Graphic
Supply chains that aren’t agile and cannot rapidly respond to change are often impacted most by disasters, and thus, the associated businesses experience extreme losses. These issues impact both businesses and government, and both can play an active role in mitigating supply chain risks, and thus, reducing losses. Governments can play a supporting role in helping companies cope with unexpected disasters and shocks, which will improve the resiliency of supply chains.
To address this, APEC economies have placed significant emphasis on supporting capacity building efforts to improve the resiliency and robustness of supply chains in the region. In 2013, APEC economies agreed on Seven Principles of Supply Chain Resilience, which provides an overarching framework to support APEC economies to manage and mitigate risks to the supply chain as a result of natural disasters. These principles are to:
Social Infrastructure is a subset of the infrastructure sector and typically includes assets that accommodate social services. We should assess those hazards to the transportation system that impact the support of a community. 1
‘To provide additional clarity around varying social infrastructure/equity impacts due to different strategies, the Spatial Temporal Economical Physiological Social (STEPS) equity framework developed by the Federal Highway Administration (FHWA) examines whether social equity barriers are reduced, exacerbated, or both by a particular strategy (Shaheen et al., 2017). The STEPS framework categorizes equity barriers to accessing transportation including considerations across spatial factors that compromise daily travel needs, temporal barriers that inhibit a user from completing time-sensitive trips, economic factors including direct and indirect travel costs, physiological barriers that make using certain travel modes difficult for disabled or older populations, and social factors like language or other barriers that detract from travelers’ comfort with using transportation (Shaheen et al., 2017).
Transportation Barrier/Benefit | Definition |
|---|---|
| Spatial | Spatial factors that compromise daily travel needs (e.g. excessively long distances between destinations, lack of public transit within walking distance). |
| Temporal | Travel time barriers that inhibit a user from completing time-sensitive trips, such as arriving to work (e.g. public transit reliability issues, limited operating hours, traffic congestion). |
| Economic | Direct costs (e.g. fares, tools, vehicle ownership costs) and indirect costs (e.g. smartphone, internet, credit card access) that create economic hardship or preclude users from traveling. Indirect economic effects also include changes in property values, rent, wages and risk of displacement due to transportation infrastructure projects or parking changes. |
| Physiological | Physical and cognitive limitations that make using standard transportation modes difficult or impossible (e.g. infants, older adults and disabled). |
| Social | Social, racial, cultural, safety and language barriers that inhibit a user’s (e.g. women, immigrants, minorities) comfort with using transportation (e.g. neighborhood crime, poorly targeted marketing, lack of multi-language information). |