

Resilience has been defined by the United States Transportation Research Board (TRB) as the ability to anticipate, prepare for and adapt to changing transportation system conditions and withstand, respond to, and recover rapidly from disruptions.
Plans such as an All Hazards and Security Guidance Plan and a Continuity of Operations Plan contain information regarding threats, vulnerabilities, roles and responsibilities. These plans contain information used at transportation departments to assist with a basic definition of resiliency.
The New Zealand Transport Agency answer to the question, What do you mean by resilience is the following:
‘Resilience is about keeping our roads open as much as possible. It’s about preserving and restoring access to the network despite disruptive events. It is about making sure our roads can absorb and withstand disruptive events, that there are planned alternative routes when roads are closed and that they are reopened as soon as possible.
Associated with this is keeping our customers well informed so they can make the best decisions about their travel plans.
In practical terms, this means our state highway network can perform effectively in a crisis, adapt to changing conditions (including climate change) and recover quickly from disturbances. It means minimising any adverse impacts on our customers’. 1 - 2
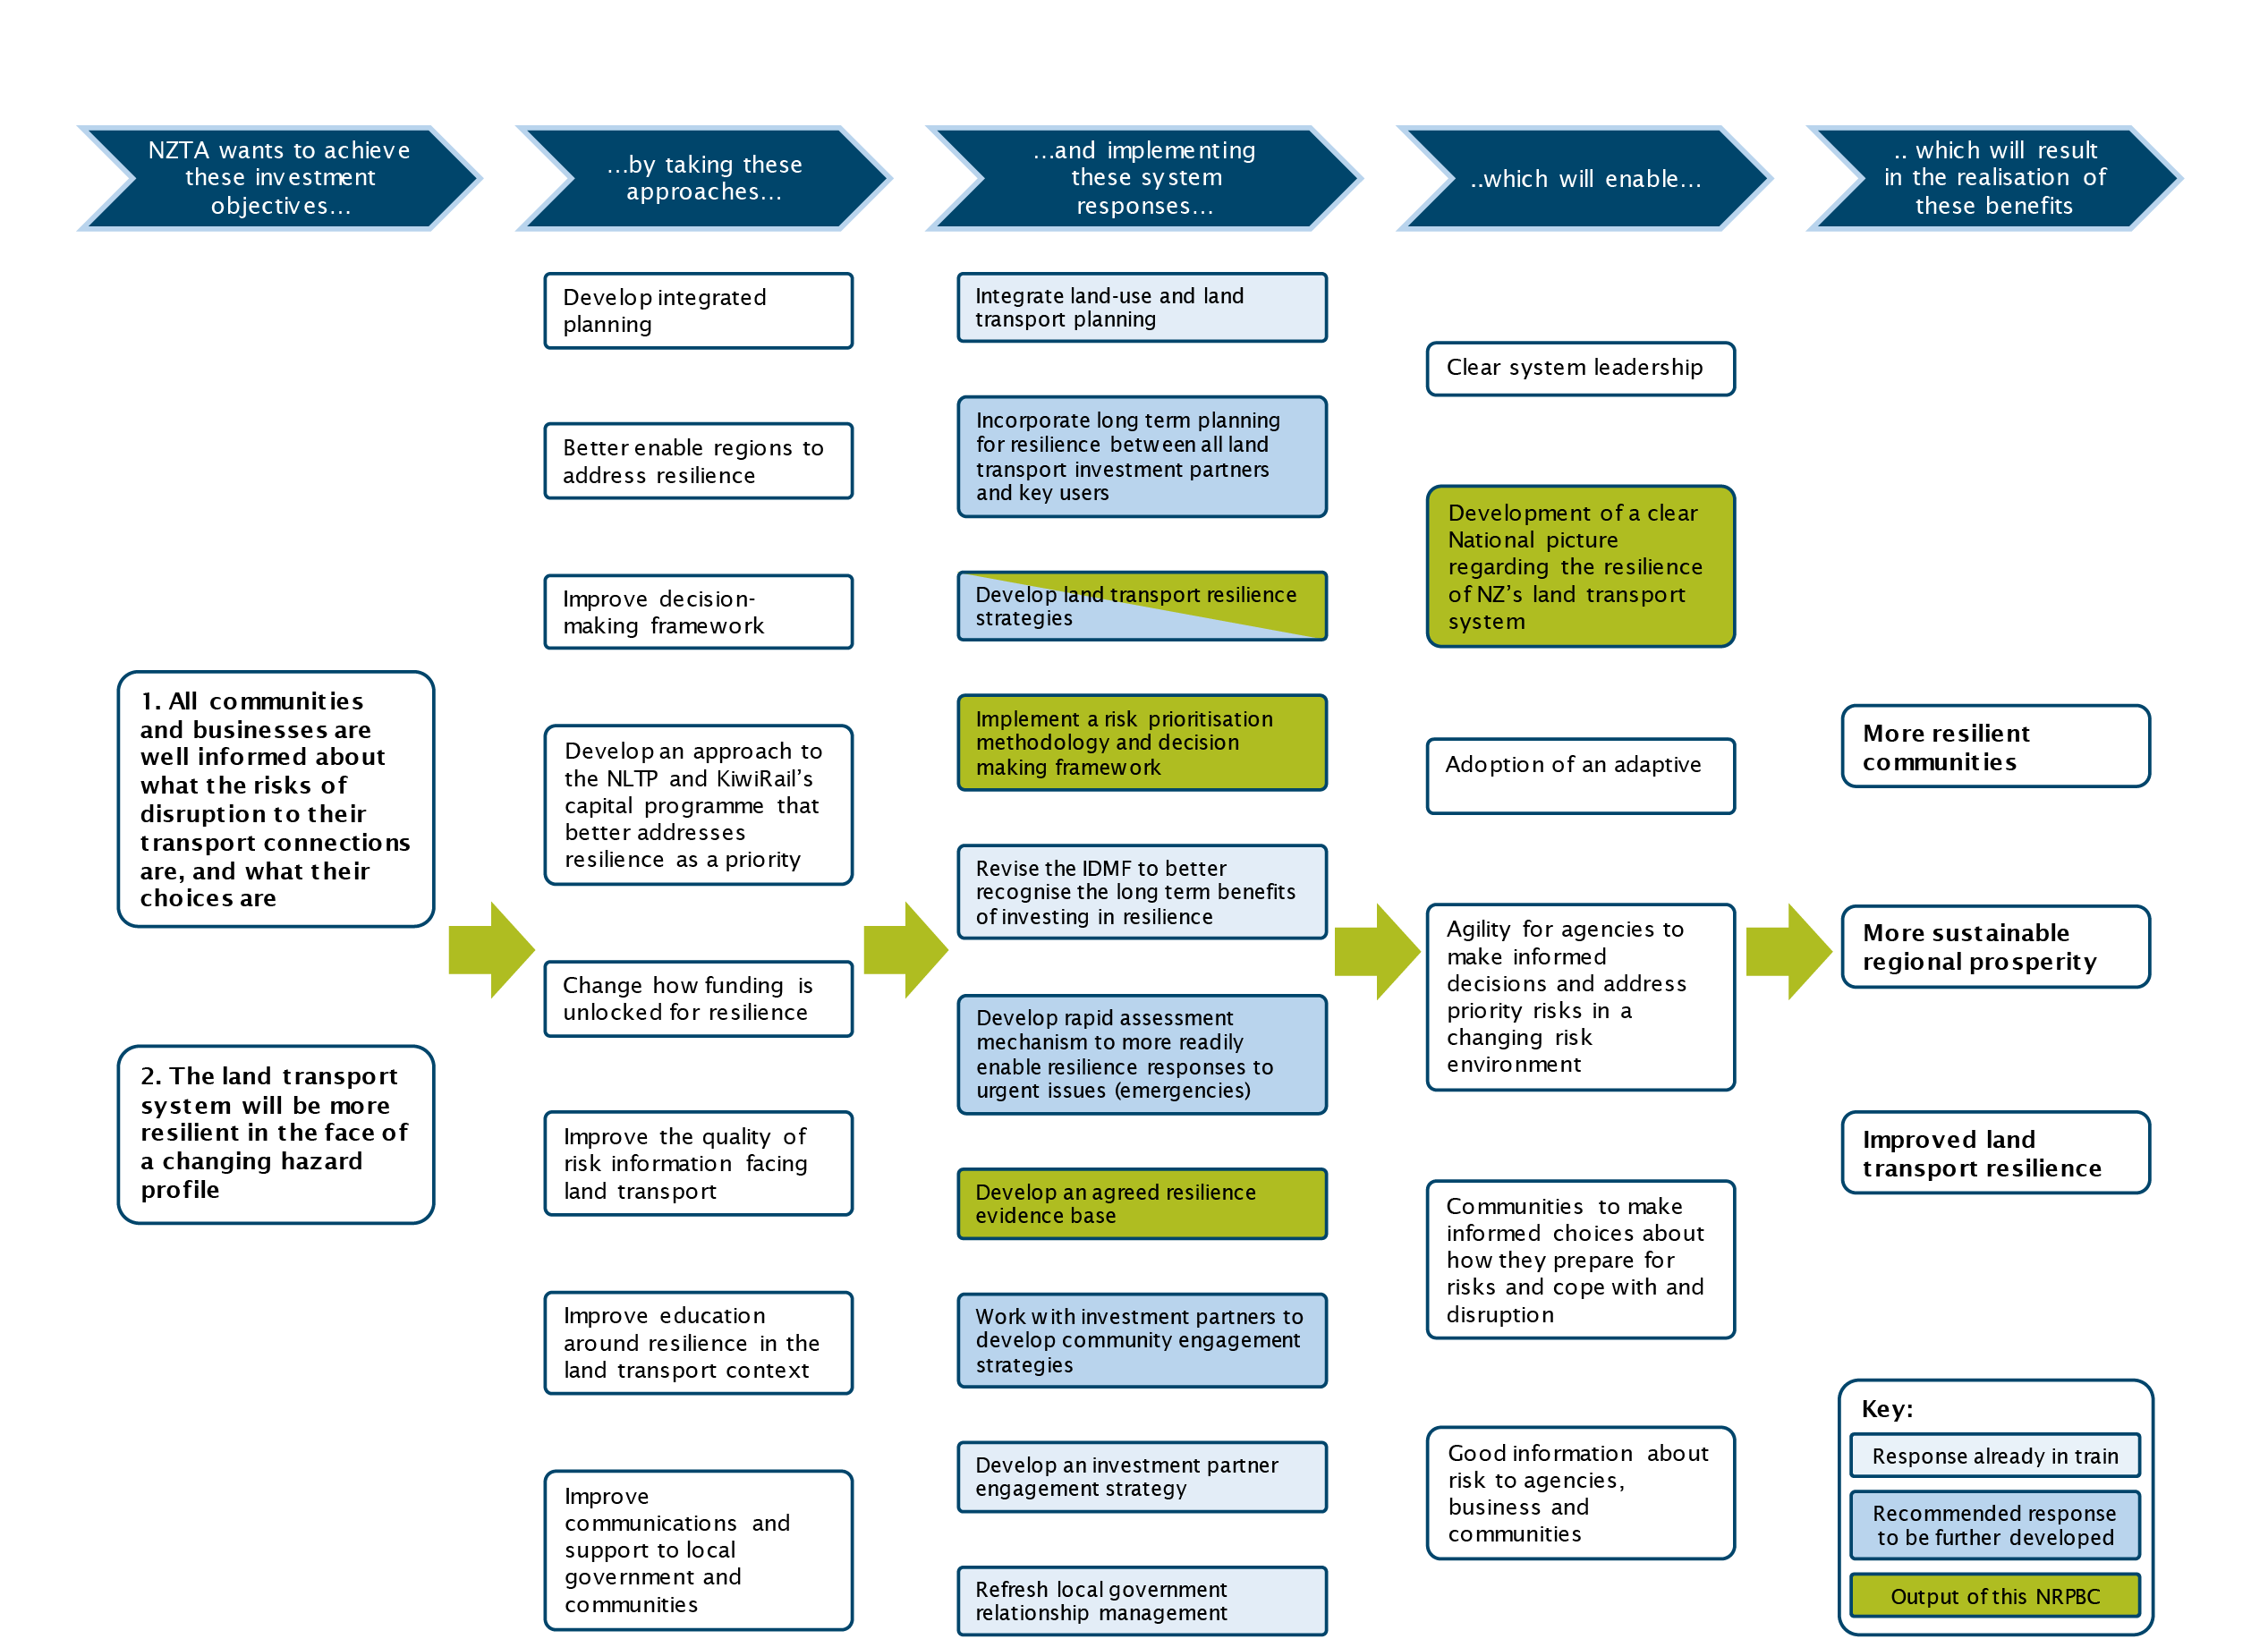
Figure 1.2.2-1 Improving Resilience of Land Transport Network to Natural Hazards
System stressors include events such as floods (flash flood, coastal flood and dry day flooding), wildfires, earthquakes, thunderstorms, hurricanes, tornadoes, typhoons, cyclones, drought, pandemic (transportation workforce), large scale transportation accidents/disasters affecting infrastructure by land (roadway, transit, railway), by sea (port, waterway/lock) and air (aviation).
California Department of Transportation (Caltrans) identified climate stressors ‘or hazards to infrastructure, public health and safety, natural systems, the economy, and other assets and systems that we rely on for a functional society. For Caltrans, the agency needed to consider which climate hazards would impact the State Highway System and its users. At the start of the vulnerability assessment, Caltrans met with internal and external subject matter experts to discuss which climate hazards could impact the highway system and why. Through these conversations, Caltrans focused the assessment on specific events and conditions that could present consequences to the state highway system.
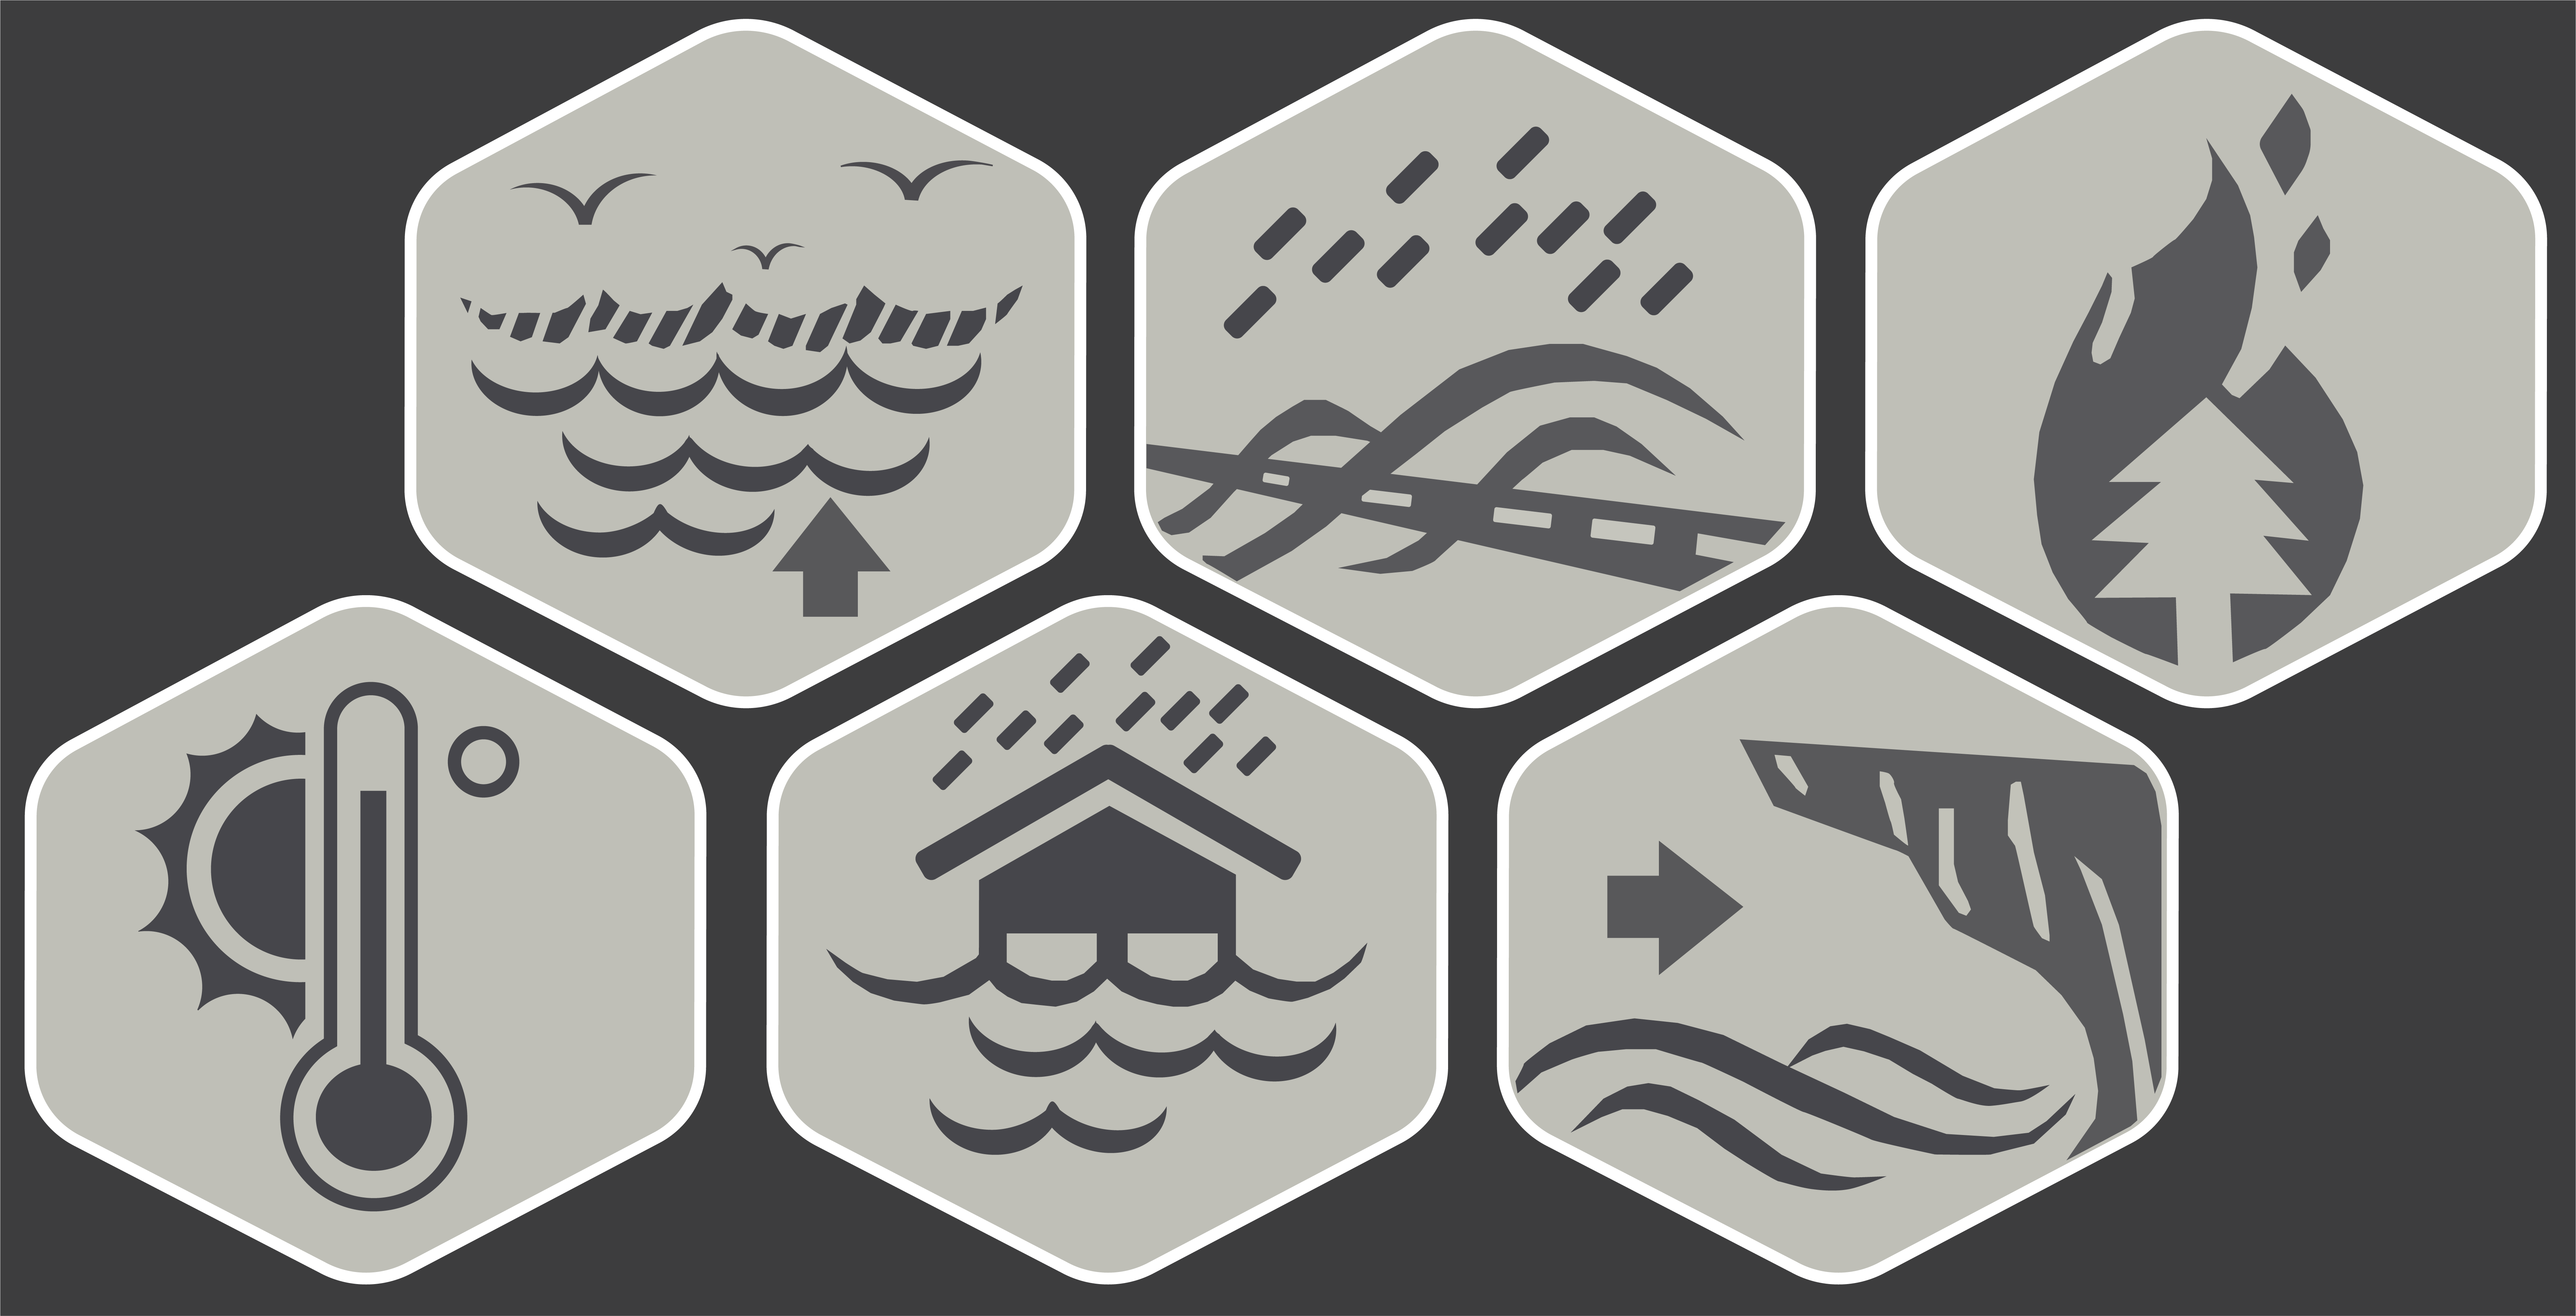
Figure 1.2.2.1.1 Vulnerability Assessment 1
Climate hazards assessed were:
Compound hazards encompassing urbanization, land use, cyber stresses and extreme climate events (i.e. rise in global temperature) also impact transportation.
The following graph from the United States National Oceanic and Atmospheric Administration (NOAA) contains global temperatures during the ten warmest years on record: 2005, 2010, 2013, 2014, 2015, 2016, 2017, 2018, 2019 , 2020 and 2021. October 2021 ranked as the fourth-warmest October in 142 years, according to scientists at NOAA’s National Centers for Environmental Information. The map below contains significant climate anomalies & events occurring globally during October 2021.
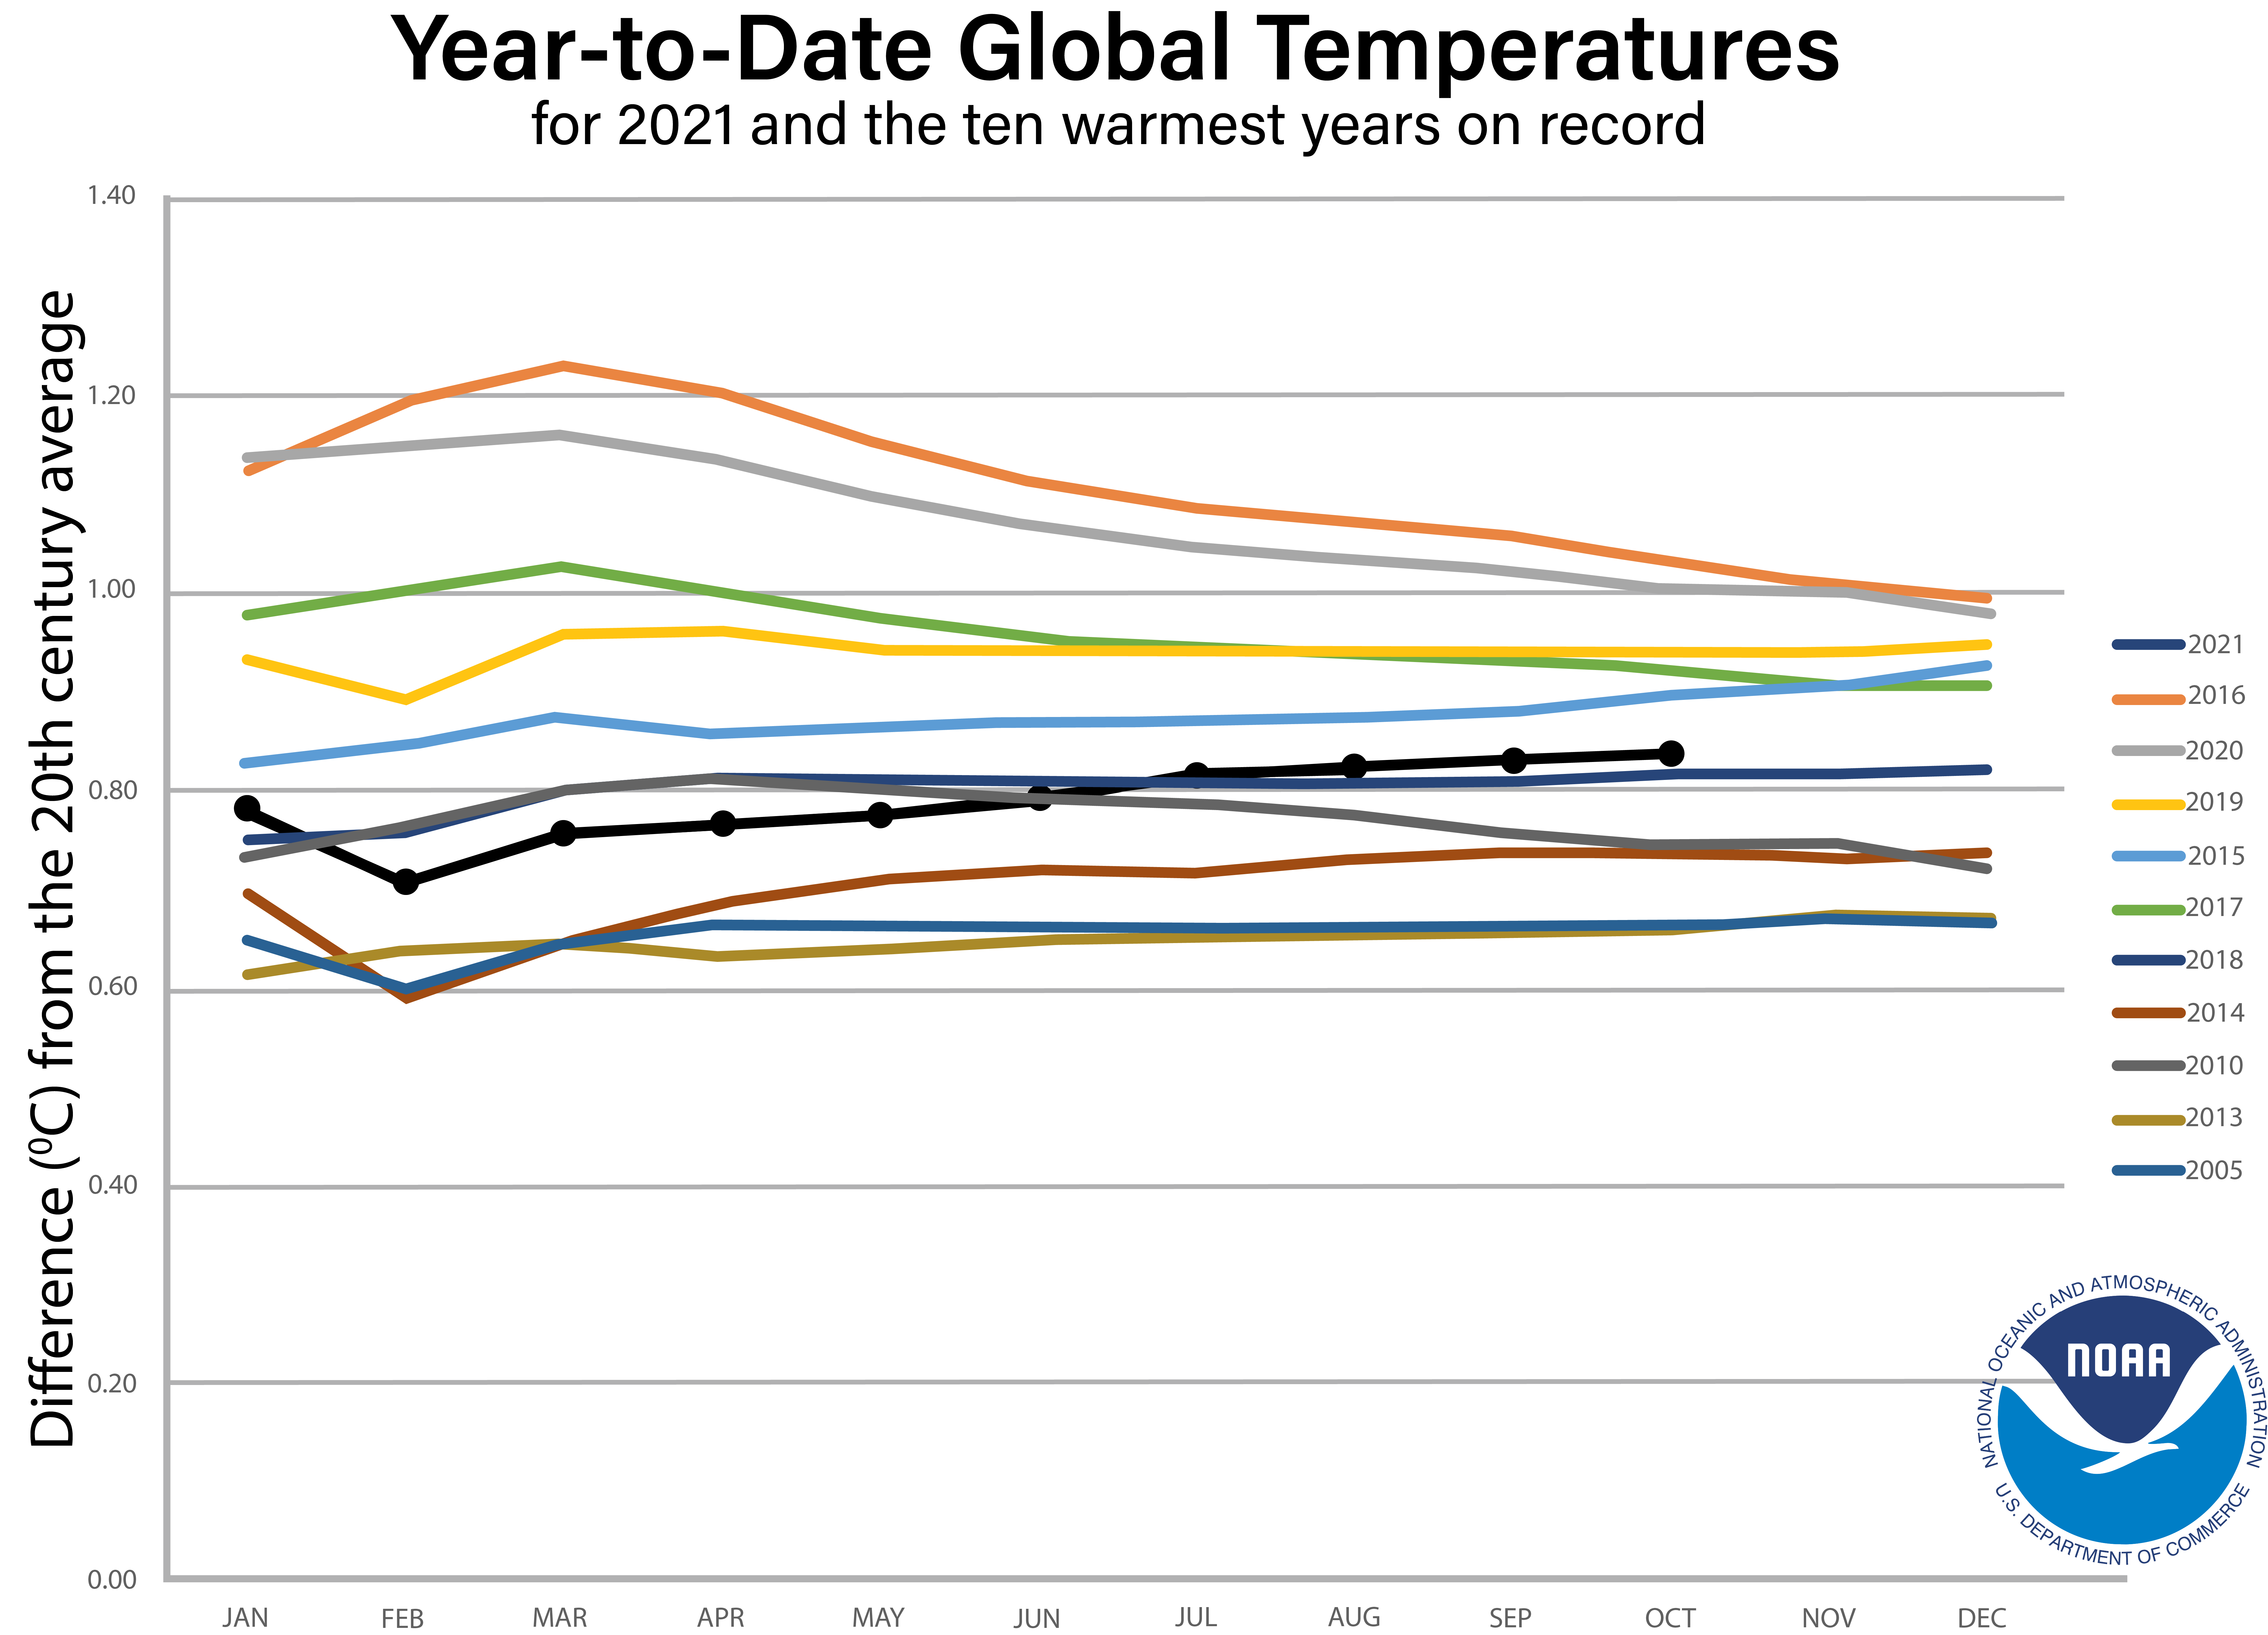
Figure 1.2.2.1.2 NOAA October 2021
Below is a map of the world plotted with some of the most significant climate events that occurred during October 2021. 2
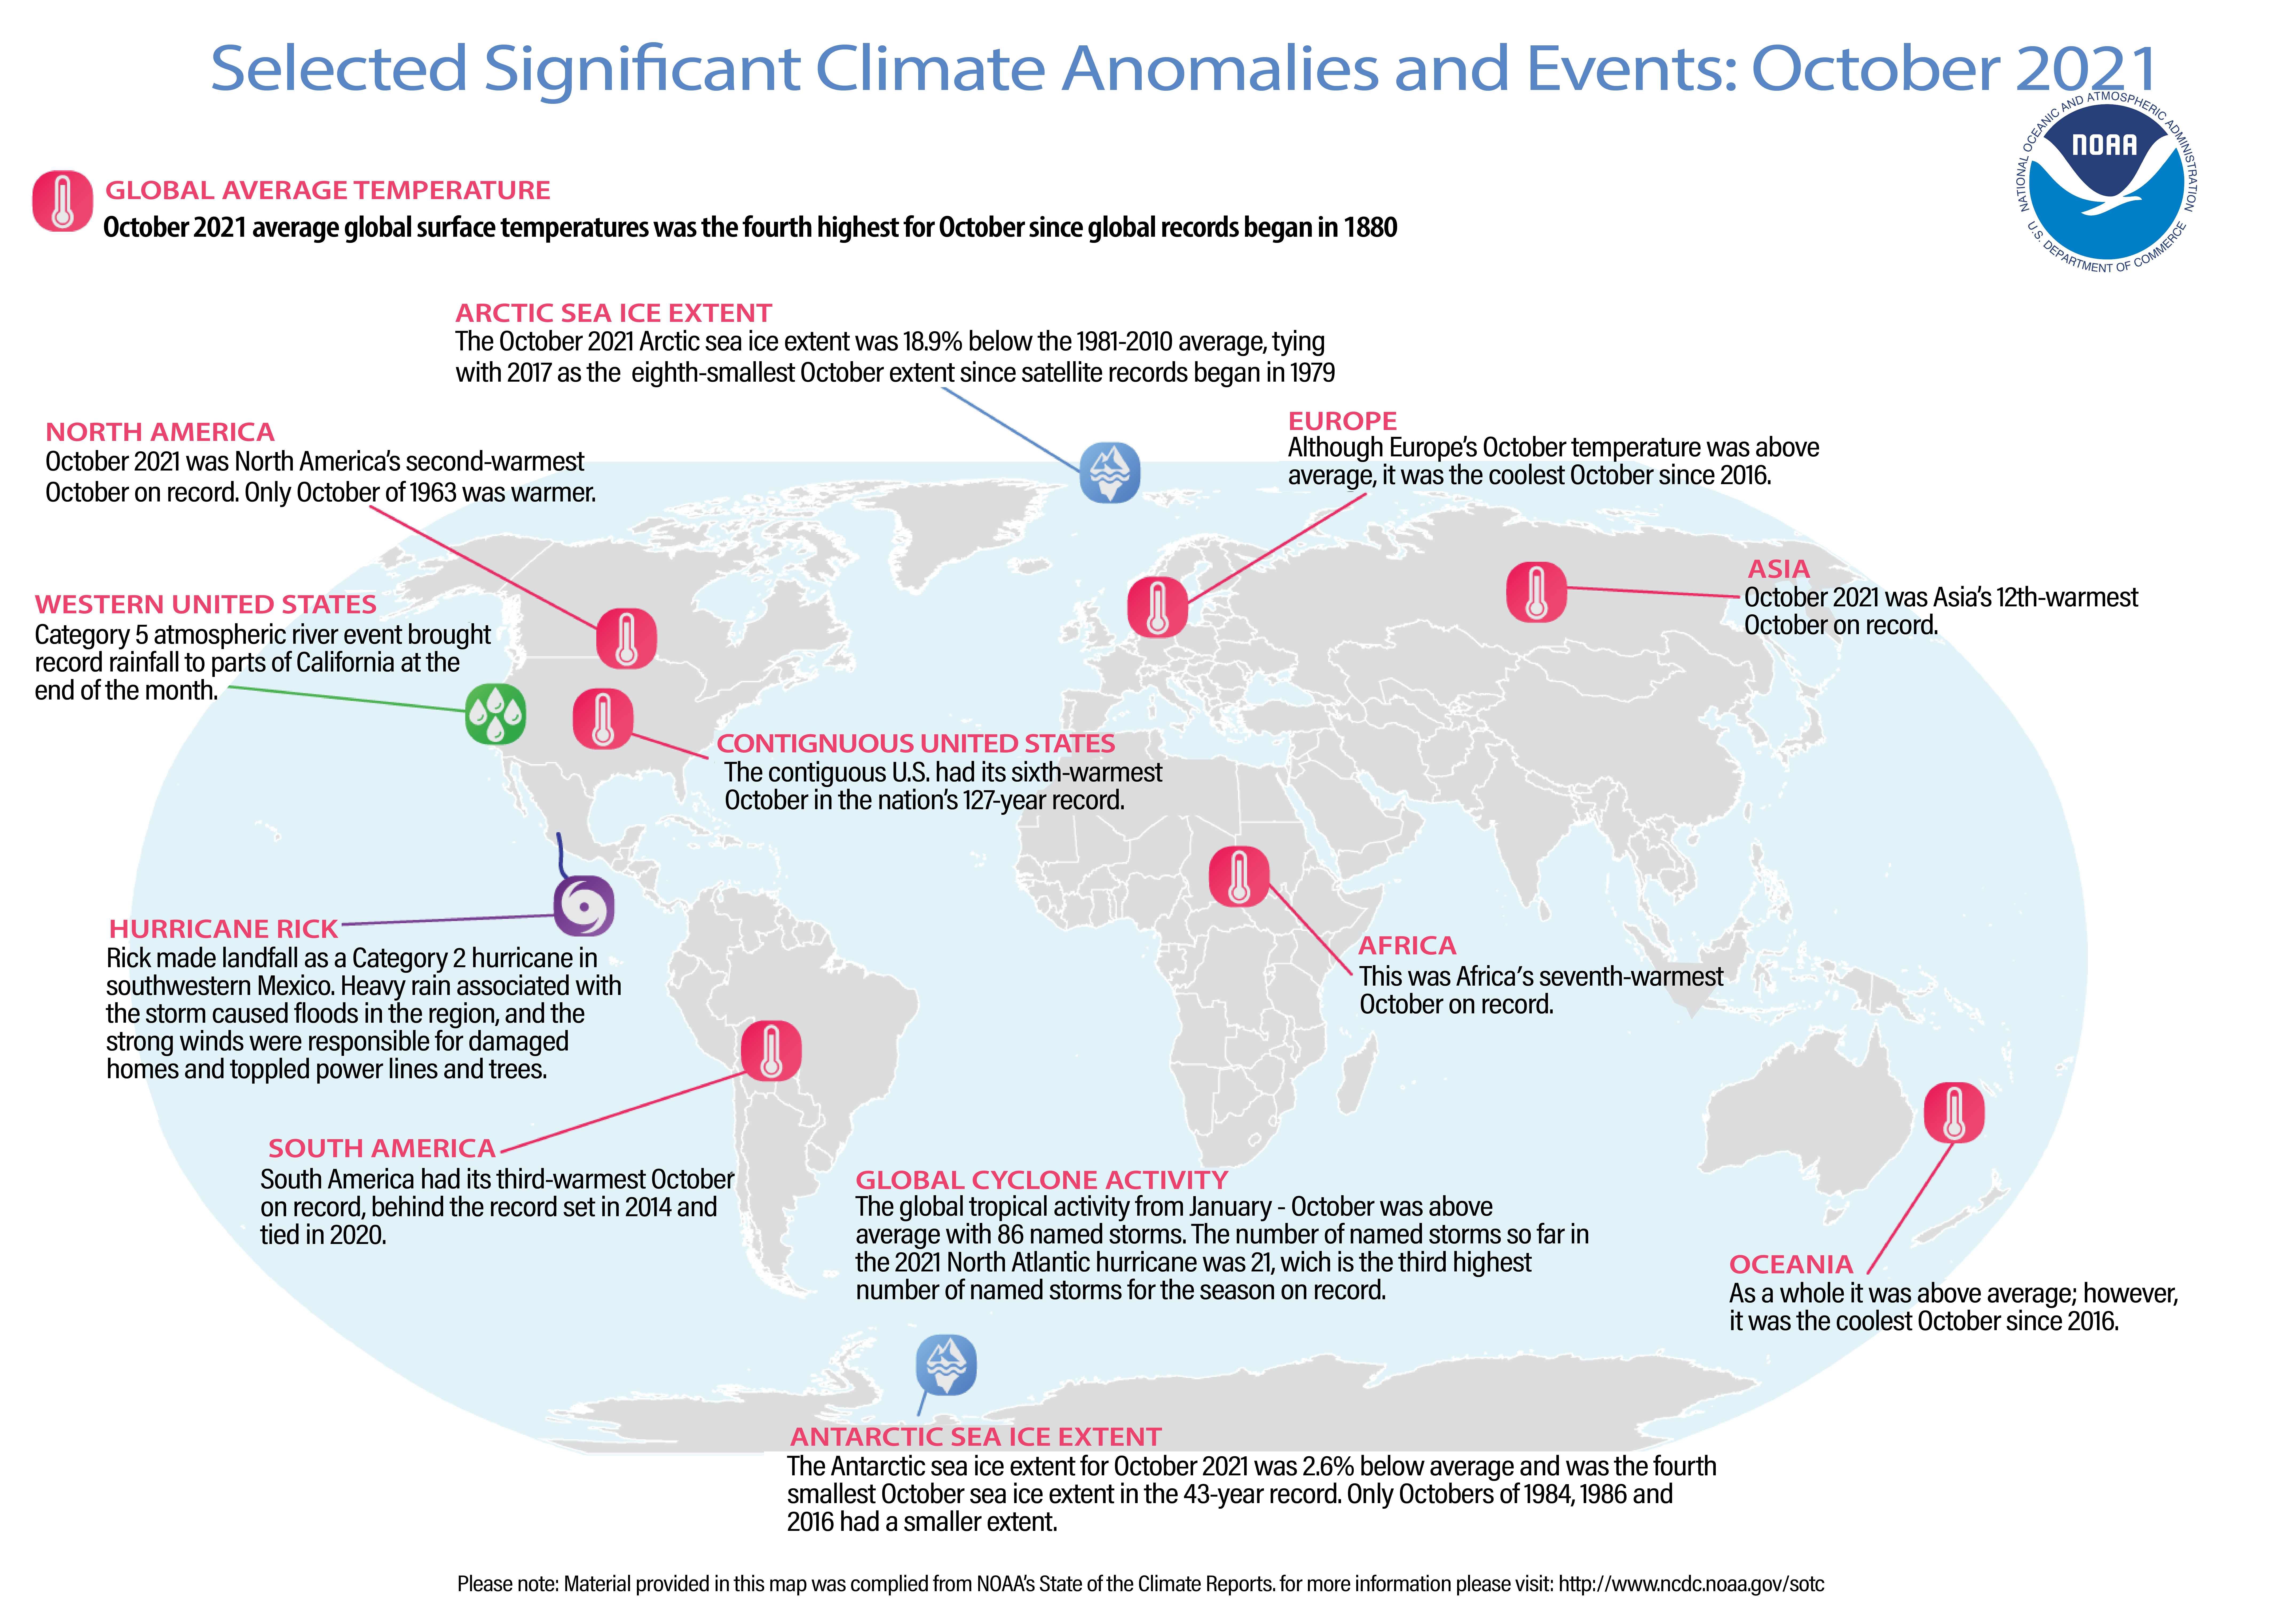
Figure 1.2.2.1.3 October 2021 Global Significant Climate Events Map
An "All Hazards & Security Guidance Plan" for transportation departments is vital to identify the methods used to reduce risks to the transportation system infrastructure posed by possible acts of natural, technological, and human-caused hazards. This plan should highlight the processes used to strengthen preparedness and promote timely response and recovery procedures that significantly reduce deaths, injuries, and other disaster losses.
The overall intent of a guidance plan is to begin to identify and manage risks and potential vulnerabilities associated with a transportation department's assets and infrastructure in order to minimize operational disruptions, ensure economic and social well-being to communities and ensure business and government continuity after catastrophic disasters.
Frameworks include infrastructure, vulnerable assets, hardened assets, multimodal connections, non-traditional networks, redundancy and also assign risk.
The New Zealand Transport Agency (NZTA) has developed a state highway classification system meeting a range of established criteria relating to factors which affect or determine the ‘criticality’ of transport assets and which relate directly to the consequences or impacts of failure.
New Zealand’s framework includes emerging drivers, key challenges and strategic context: carry high volumes of traffic or freight (this would include most rail routes and major highways, port access), are vital to social/economic well being, have no other alternate route, provide access to other critical infrastructure, are control centers, are sections of a network that are critical to commercial imperatives for operators or users, are critical to maintaining law and order, or national security, provide for emergency response (police, fire, medical services, disaster relief), provide for operation of public services, commercial and business travel, high-value personal errands (basic shopping, medical), commuting (work and school). 1
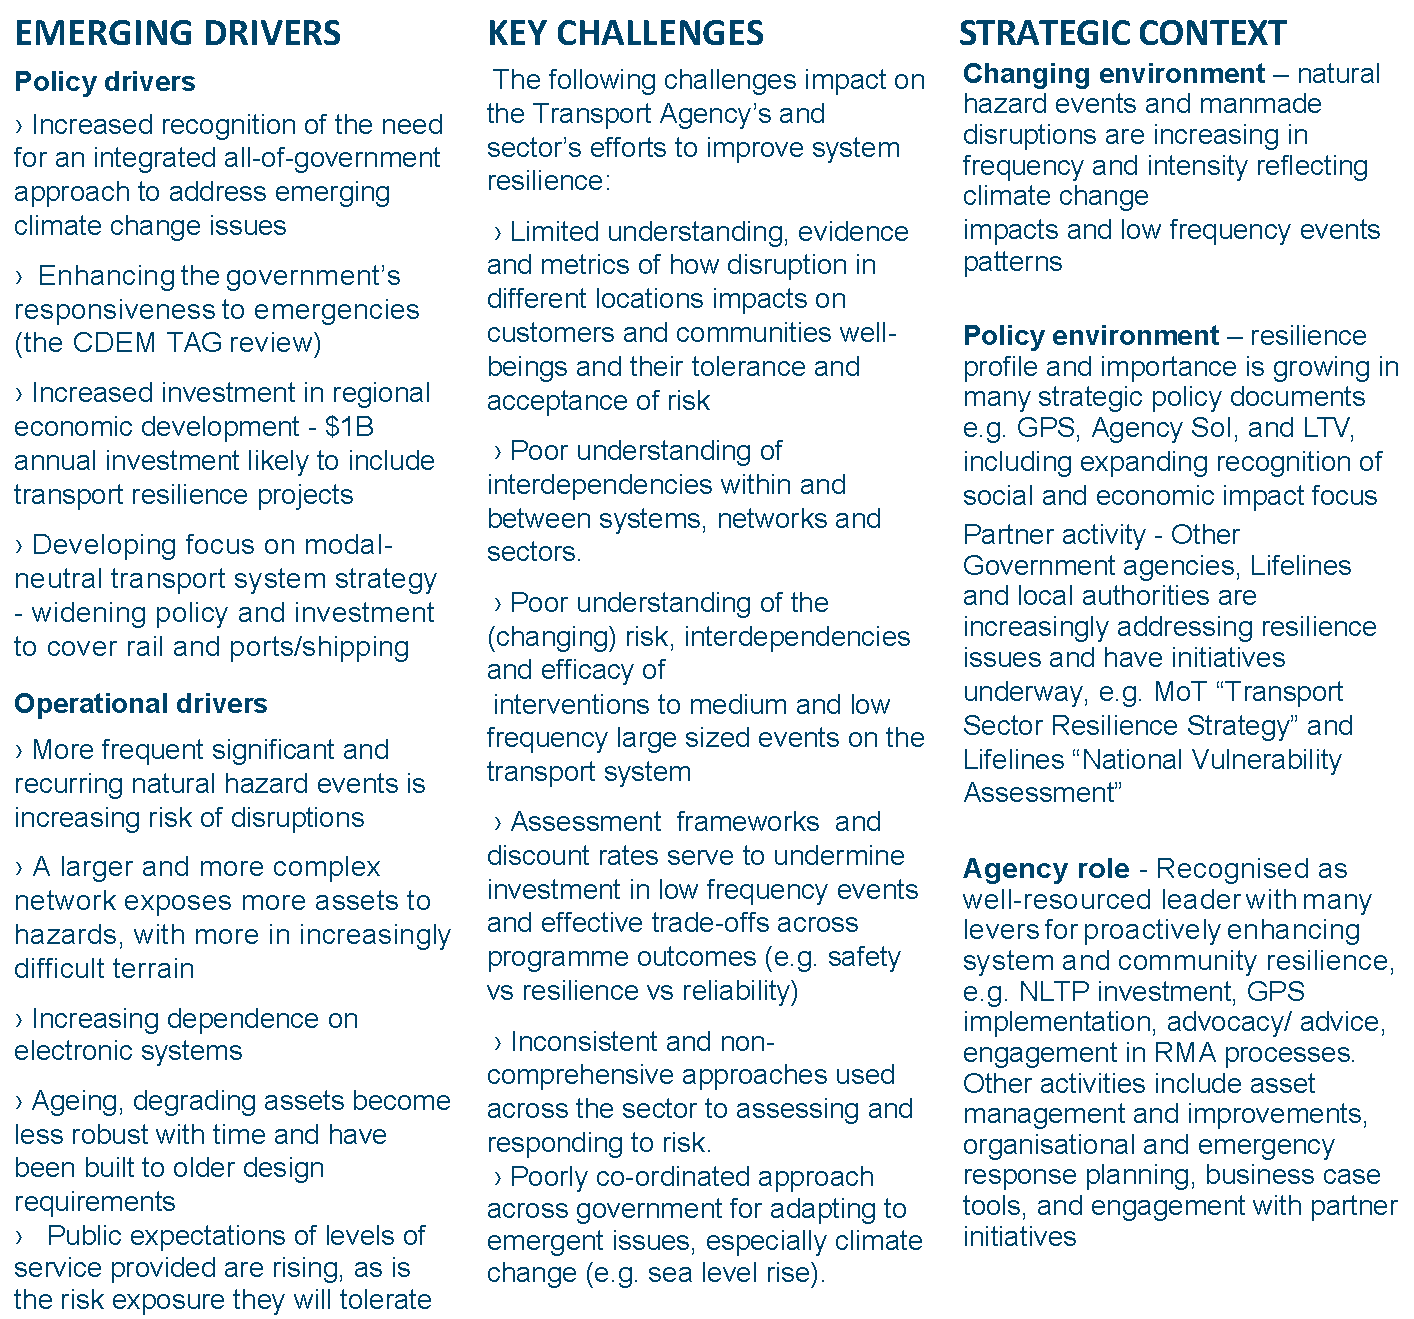
Figure 1.2.2.2 New Zealand Transport Agency Graphic
Vulnerability identifies scale, understands populations including environmental aspects of place, is community supported with redundant systems that plan for utility corridors and aqueducts with redundant power grids and pipelines.
The California Department of Transportation’s (Caltrans) ‘methodology used to determine the vulnerability of highway system assets varies from one climate stressor to another. Each stressor uses a different set of models, emissions scenarios, and assumptions, and will cause different types of impacts to the state highway system.
Caltrans manages different transportation assets around the state, the Climate Change Vulnerability Assessment focused on the state highway system and the assets that make up the system (e.g., bridges, culverts). Caltrans focused on its highways as they are critical to serving transportation needs and economies across the state, and Caltrans is responsible for managing their condition. Caltrans evaluated state highway system exposure to climate stressors one district at a time, for each of the 12 districts across the state. 1
‘Caltrans created a ArcGIS Online mapping tool that allows users to view the data applied in the Caltrans Climate Change Vulnerability Assessment. This tool enables Caltrans staff, stakeholders, policymakers, and California residents to view different climate change projections and identify the state highway system’s exposed areas. The map viewer is dynamic and incorporates new data as it is obtained from various Caltrans projects, identifying which Caltrans assets are exposed to threats from temperature rise, sea level rise, storm surge, cliff retreat, and wildfire events requiring complex geospatial analyses.’ 1
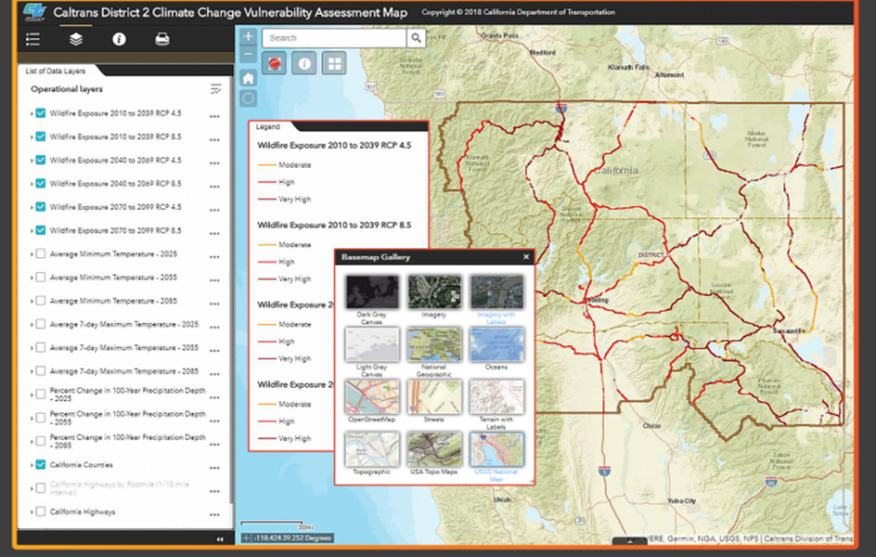
Figure 1.2.2.3 Caltrans Climate Change Vulnerability Assessment Map
Community team building results in a defined, fluid outcome and is the basis for managing risk. ”Disasters can have significant and depleting immediate and long-lasting impacts on government budgets and finances, and these impacts may be difficult, if not impossible, to recover from. The National Oceanic and Atmospheric Administration (NOAA) National Centers for Environmental Information (NCEI, 2019) estimates that the nation (U.S.) has experienced 254 weather and climate disasters from 1980 to the present for which total costs exceed $1.7 trillion. The following map shows United States weather and disaster costs from 2021: 1
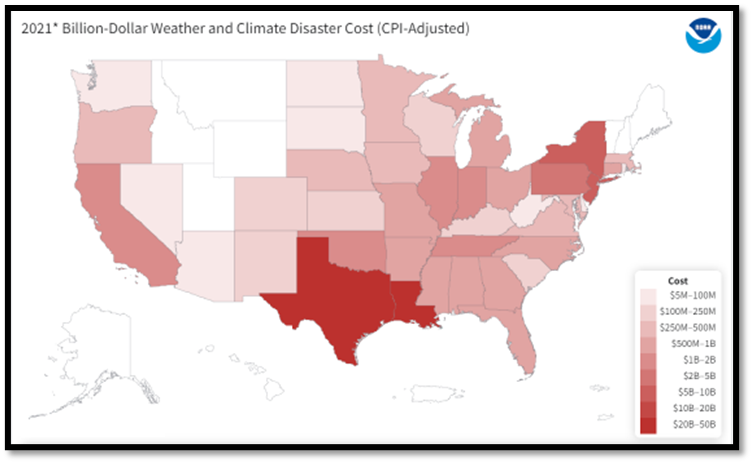
Figure 1.2.2.4.1 United States weather and disaster costs for 2021
A key element in risk management from New Zealand’s Transport Agency (NZTA) is called a Portfolio Risk Assessment (PRA). ‘This assessment results in a database identifying and rating risks to the land transport system. It is not a detailed risk assessment; but is a practical high-level assessment that enables Waka Kotahi to better prioritize resilience risks and develop response strategies. The portfolio risk assessment methodology adopts a Likelihood and Consequence approach to assess risk as outlined in International Organization for Standardization (ISO):31000 Risk Management Principles and Guidelines (ISO, 2009).’ 2
‘Shock events such as earthquake, tsunami, rock-fall or storm-induced flooding and landslip require addressing slightly differently to that of climate-related hazards such as coastal inundation, coastal erosion and groundwater rise (influenced by sea-level rise, refer section 3.2). This PRA approach uses combined likelihood and consequence parameters that influence the level of risk.’ 3

Figure 1.2.2.4.2 Portfolio Risk Assessment (PRA)